Weekly Macro Report
Macro Brief — July 06, 2026
Retirees hoarding cash lose $39,000 a year while tech selloffs confirm the stagflation trap is tightening.
Parson Tang — July 6, 2026Powered by MARY
The VIX dropped from 18.41 to 15.81 this week, and that movement tells you more about the market’s confusion than its conviction.
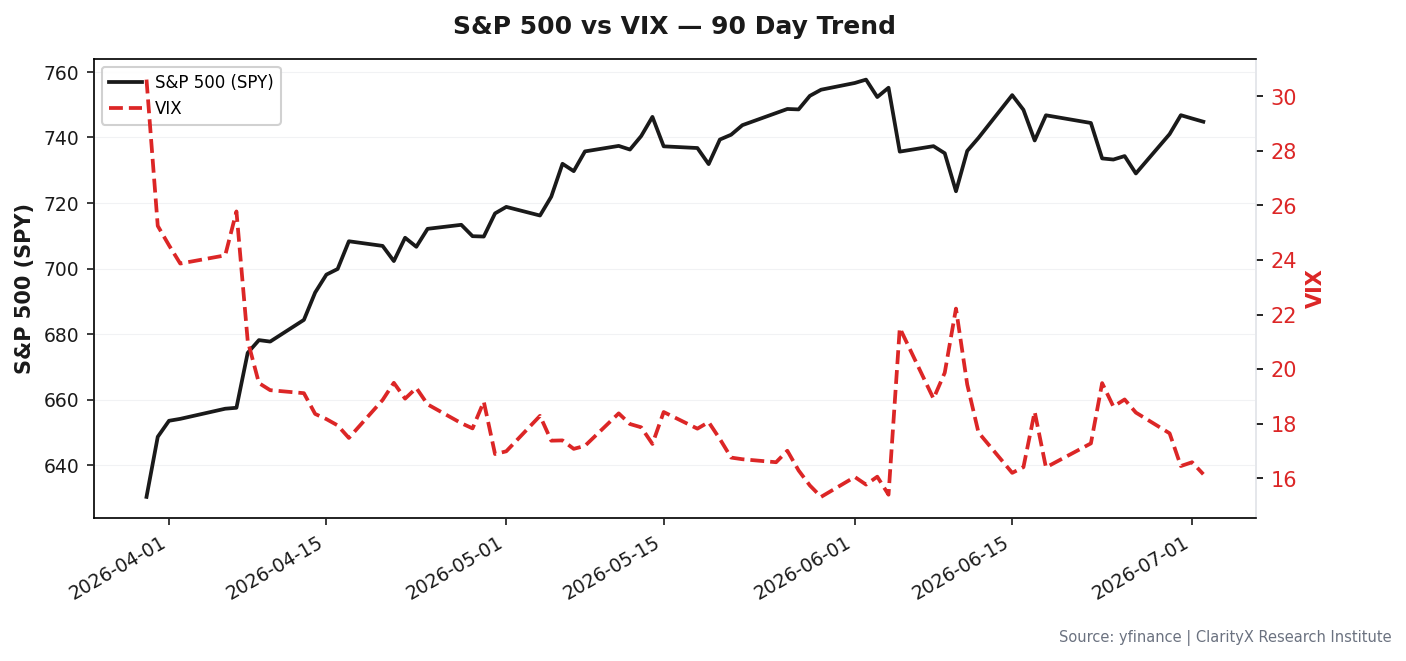 S&P 500 vs VIX — 90 Day Trend
The picture is largely unchanged from last week, but the widening gap between the rules-based model and the ML signals is the story worth watching. The rules-based model still sees 9 of 11 sectors lagging, wage growth stuck at 3.45%, and an inverted yield curve at 0.68 z-score, and calls it stagflation. The ML signals, meanwhile, are picking up the tech-led rotation and assigning a 32% probability of a late-cycle transition in 3-6 months. This is not a regime change—it’s a regime disagreement. And when models disagree, the honest signal is usually the one that costs you money first.
Regime confidence slipped from 44.8% to 43.4%, a modest erosion that reflects the market’s inability to resolve the fundamental tension. Inflation remains 2.2 standard deviations above average—that is the bearish anchor. Oil eased to $69.39, down from $70.30, which provides some relief but not enough to break the stagflation narrative. The credit market remains the most honest forward-looking signal: High-Yield OAS tightened to 3.90% from 3.97%, and the Baa-Treasury spread sits at 0.94%. Neither is flashing distress. Corporate borrowers are not panicking, and that is the single most important counterweight to the stagflation narrative. If the economy were truly rolling over, credit spreads would be blowing out. They are not.
The tech-led rotation is the dominant sector signal this week. Technology (XLK) has returned +33.73% over three months, outperforming the S&P 500 by +19.47%. That is not a defensive rotation—that is a growth-led bet that the earnings recession is ending and that AI capex will sustain margins. The risk is that this is a crowded trade with no room for error. If tech earnings disappoint, there is no sector rotation to catch the fall. Defensives and cyclicals are both lagging, which means the market is all-in on one story.
What I’m watching most closely is the distance from our danger thresholds. The VIX is now 54.8% away from the panic threshold of 35.0, which is further than last week’s 47.4%. The NFCI is 20.3% away from its trigger, also further. These are not all-clear signals—they are "not yet" signals. The market is pricing perfection in tech and stagnation in everything else, and that kind of bifurcation rarely ends cleanly.
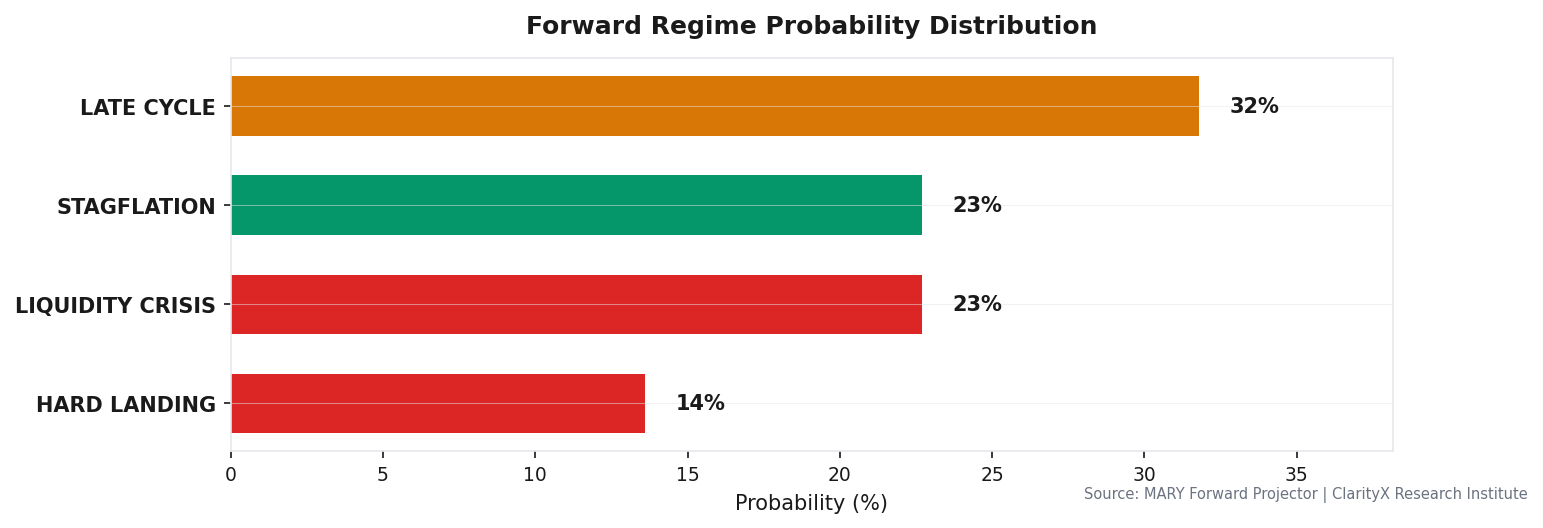 Forward Regime Probability Distribution
What Would Change My Mind:
-
If High-Yield OAS breaks above 5.0%: That would be the credit stress signal that overrides the equity market’s optimism. The current reading is 3.90%, so we have 110 basis points of room. If that gap closes, I will rotate within equity from growth to quality/low-volatility names and add gold ballast funded from the bond bucket. The equity anchor stays at 60%.
-
If weekly jobless claims exceed 236,500: The current reading is 215,000. A sustained breach of that threshold would confirm labor market weakening beyond the tech layoff narrative. I would tilt within equity toward pricing-power sectors (staples, healthcare) and add TIPS funded from the bond bucket. No equity reduction.
-
If the VIX crosses 35.0: That is the panic threshold. It is currently 15.81, so this is not imminent. But if it happens, the correct response is not to sell equity—it is to buy weakness as a rebalancing opportunity toward the anchor, rotating within equity into low-volatility names and adding gold funded from bonds.
The strategic equity allocation is the anchor. It does not get cut in response to a VIX spike, a credit-spread blowout, or a regime downgrade. Time in the market beats timing it. When conditions deteriorate, the correct action is always a within-equity tilt and a bond-funded ballast move—never a move to cash.
Levels that matter: VIX 15.81 · WTI $69.39 · HY OAS 3.90% · Weekly jobless claims 215,000 · 10Y real yield 2.19%
For the full signal dashboard, allocation table, and watch list, see this week's CIO Weekly →
Get this research delivered
New analysis, directly to your inbox. Research notifications only.