Weekly Macro Report
Macro Brief — May 26, 2026
Oil’s $5 crash bought Wall Street a peace rally, but $4.35 trillion in corporate profits can’t hide the stagflation math.
Parson Tang — May 26, 2026Powered by MARY
Oil dropped $5.16 this week to $91.44, and that single number is doing more work than any Fed speech or headline out of the Hormuz talks. The regime stays at STAGFLATION with confidence stuck at 46.9%, and the picture is largely unchanged from last week — but that oil move is the reason I am watching, not relaxing.
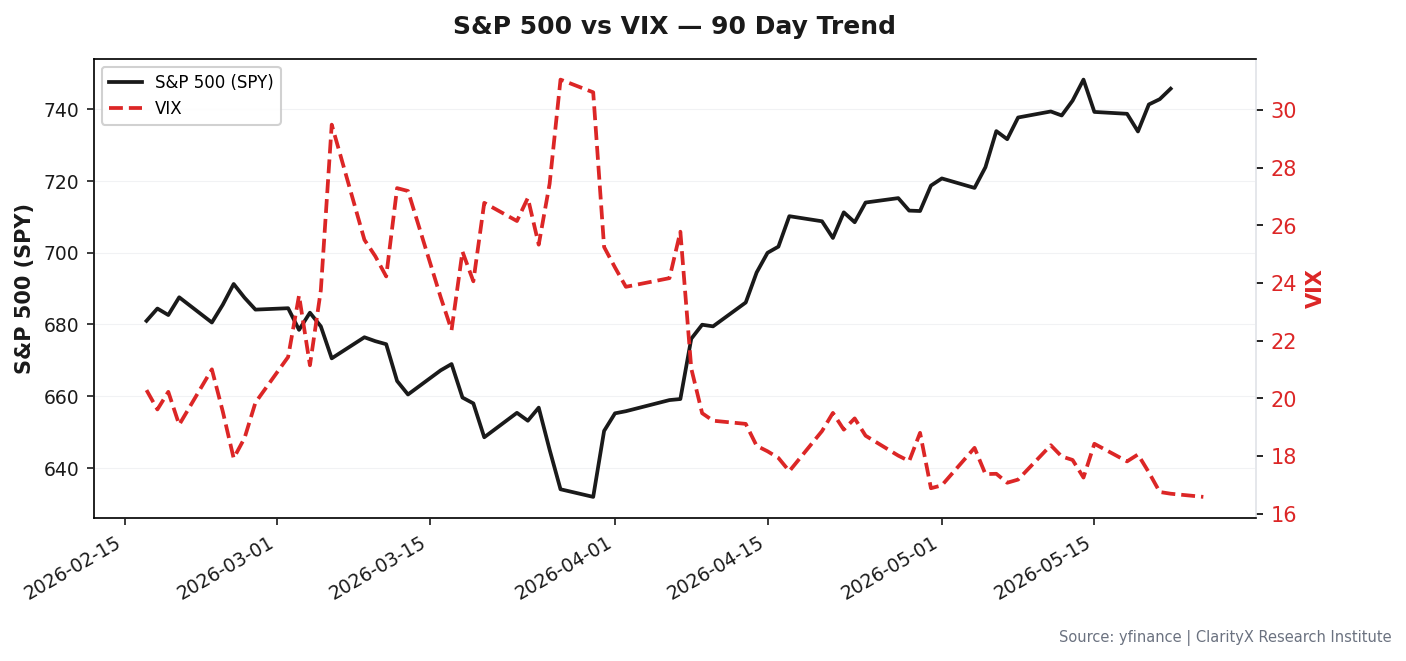 S&P 500 vs VIX — 90 Day Trend
Let me be direct about where last week's call was wrong. I had flagged the Hormuz closure as the new dominant variable, with oil at $96.60 and Michigan expectations at 3.5% past the 3.0% trigger. The oil decline is real and welcome, but it has not yet broken the stagflation pattern. CPI is still 3.95% YoY, PCE is 3.5%, and real yields at 2.30% remain restrictive. The market's sigh of relief on the Hormuz reopening talk is premature if the underlying inflation data has not budged. The confidence number is unchanged because the signal vector is mixed: lower oil is bullish for the growth side, but wage growth at 3.57% and unemployment at 4.3% keep the inflation component sticky.
The transmission mechanism this week is straightforward: lower oil reduces input costs across transportation, chemicals, and consumer discretionary, which is why you saw S&P 500 futures rise on the headlines. But the equity allocation is already at 42.0%, and the defensive shift of 3% triggered by the warning-level trip wire remains in place. I am not adding risk here. The yield curve steepening (10Y-3M at 0.88%, z-score +2.07) is the one genuinely bullish signal — it says the market expects growth to hold. But that same steepening, combined with inflation still 1.3 standard deviations above average, is exactly the recipe that keeps the Fed on hold. Kevin Warsh inherits a Fed that Wall Street has almost stopped talking about, and that silence is dangerous. A Fed that is not in the conversation is a Fed that can surprise you.
The sector rotation story supports caution. The LEI is expanding at 56.36% YoY — that is not a recession signal — but the forward risk summary puts 32% probability on LATE_CYCLE in 3-6 months. That is a gradual transition, not a cliff, but it means I am positioning for a slowdown, not a boom. The BAA-10Y spread at 0.94% and HY OAS at 4.39% are still tight, which is the credit market's vote of confidence. But tight spreads in a stagflation regime are a divergence, not an all-clear. If the oil decline continues and inflation follows, the regime shifts. If oil stabilizes here and inflation stays elevated, the regime holds and the equity rally fades.
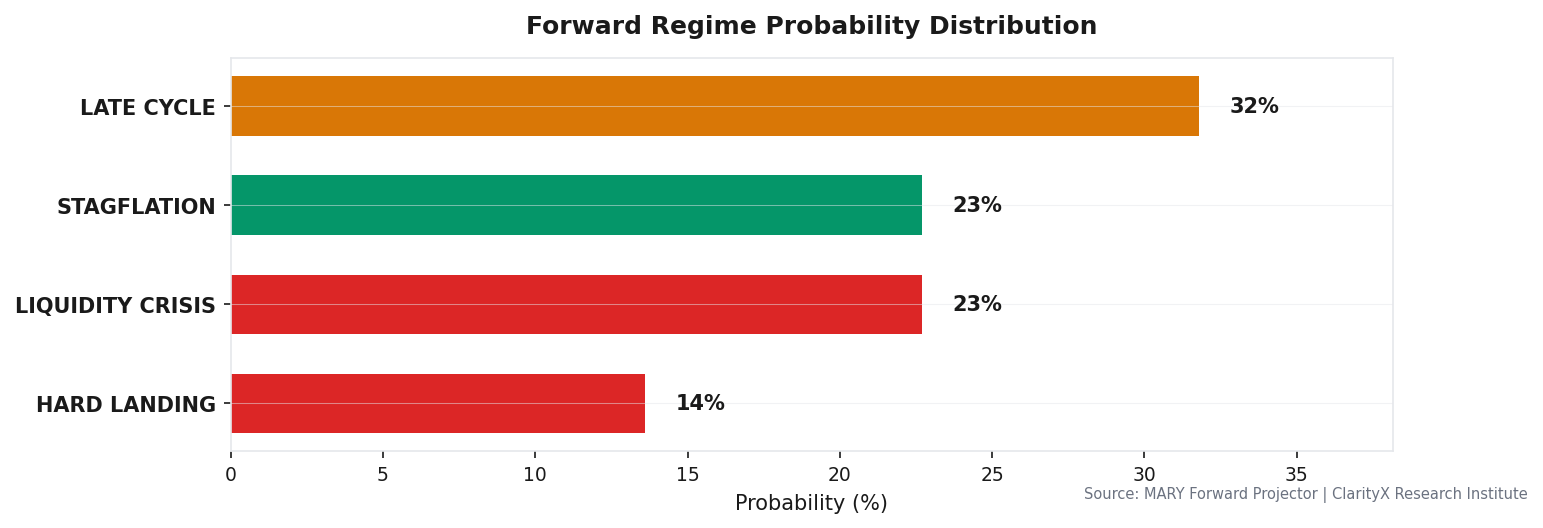 Forward Regime Probability Distribution
What Would Change My Mind:
-
High-Yield OAS breaks above 5.0%. That is the credit stress line. If HY OAS widens from 4.39% to 5.0%, the tight spread narrative breaks and I reduce equity from 42.0% to 38.0%, adding to cash. This is the single credit indicator I am watching — not Baa-10Y, not IG.
-
Weekly jobless claims exceed 236,500. The current unemployment rate at 4.3% is manageable, but a sustained weekly claims print above the engine threshold signals the labor market is softening faster than the GDP data suggests. If that happens, I cut equity beta by shifting 3% from equities to gold and raise the defensive tilt from 3% to 6%.
-
VIX crosses 35.0. At 16.76, volatility is complacent. A spike above 35 is a panic signal, not a buying opportunity. If VIX hits that level, I execute the full defensive override: reduce equity to 38.0%, increase cash to 17.0%, and increase gold to 15.0%. No waiting for confirmation.
What I'm Doing: Sitting at 42.0% equity, 14.0% cash, 13.0% gold with a 3% defensive tilt triggered by the warning-level trip wire. The oil decline is a positive, but it has not yet changed the regime calculus. I am monitoring the three thresholds above and will act on the first one that breaks. The signal dashboard is telling me to hold, not to chase.
Levels that matter: WTI $91.44 · VIX 16.76 · HY OAS 4.39% · Weekly jobless claims 236,500 · 10Y real yield 2.30%
For the full signal dashboard, allocation table, and watch list, see this week's CIO Weekly →
Get this research delivered
New analysis, directly to your inbox. Research notifications only.