Weekly Macro Report
Macro Brief — April 06, 2026
The market is pricing a pause. The market is wrong. Oil is at $111.
Parson Tang — April 6, 2026Powered by MARY
The market is pricing a pause. The market is wrong. Oil is at $111.
What happened this week
The collective shrug is over. WTI ran from $106 to $111 in four days. The VIX jumped to 24.5. Gold ripped 7% to $4,294. The S&P is clinging to its 200-day moving average.
This isn't a pause anymore. It's the crack in the consensus I warned about last week — the bet that oil wouldn't feed into inflation expectations is now being called.
The regime is shifting
Last week, I said the 50% Late-Cycle reading understated the risk. That's proving out now.
MARY's forward-risk model is flashing a 28% probability of a LIQUIDITY CRISIS within 0–3 months. That's not a slow transition — that's an event. The system shows 22 critical trip wires already breached. We're not debating which regime we're in. We're watching the system search for a trigger.
CPI on April 10 is the trigger to watch
Oil is up 11.4% in five sessions. The April 10 CPI print is not just a data point — it could be a regime-changer.
Here's the disconnect:
- The market expects the Fed to stay patient (Fed Funds at 3.64%)
- Inflation expectations are anchored at 2.58% (Michigan survey)
- But a hot core CPI print would force the market to reprice — not just "higher for longer," but "higher, and maybe more"
That's the hawkish pivot that breaks credit spreads and drains liquidity.
Credit markets are dangerously complacent
This is the fragile part. Credit spreads are still tight:
- Investment-grade (Baa): 1.09%
- High-yield: 3.04%
These levels are priced for a soft landing — a Fed that has the luxury of patience. But VIX at 24.5 and gold at all-time highs are telling a completely different story. One of these markets is wrong.
When credit is relaxed and everything else is nervous, the shock usually comes from outside the credit market and crushes it. That's the liquidity crisis path.
Sector rotation confirms the stress
The rotation is messy — classic late-cycle fragmentation:
- Winners: Energy (XLE, +37% relative strength), Materials, Utilities, Staples
- Losers: Technology, Consumer Discretionary
The market is simultaneously betting on the oil shock and hiding from its consequences. It can't decide if this is an inflation trade or a growth scare, so it's buying both sides and selling the middle. That's not healthy rotation. That's confusion.
Historical analog: 2013 Taper Tantrum — but worse
The closest match is the 2013 Taper Tantrum. Similar setup: an economy doing okay (GDP ~2% then, ~4.4% now), with the market violently repricing the expectation of Fed tightening.
The critical difference: in 2013, the Fed had room. Inflation was benign. Today, PCE is at 2.83%. If oil keeps pushing inflation higher, this isn't a tantrum — it's the start of a real tightening cycle. That's the 1994 risk, not the 2013 replay.
What I'm doing
I'm not exiting. But I'm building a bunker. The cost of being wrong about a liquidity event is far worse than the cost of being too cautious.
Adding:
- 3% position in long-dated VIX calls — pure insurance. If CPI is a dud, I lose the premium. If it's the trigger, the payoff is asymmetric.
- Holding and slightly adding to Energy (XLE) overweight — it's crowded at 37% RS, but it's the only hedge that pays you to wait through dividends and cash flow. I'll trim if WTI breaks below $100.
Avoiding:
- Long-duration Treasuries — real yields at 2.30% have room to spike if inflation expectations unanchor
- Broad high-yield credit — 3.04% spread offers no margin of safety in a late-cycle oil shock
- Technology — reduced to minimum benchmark weight. This is not its environment.
Bottom line
The probability of a bad outcome has increased faster than the market's pricing of it. The gap between MARY's 28% liquidity crisis probability and the 3.04% high-yield spread is the risk premium that's vanished.
My job isn't to predict the CPI print. It's to make sure the portfolio can handle it if it's the match that lights the fuse.
Levels that matter: S&P 500 5,112 · WTI $111 · 10-Yr Real Yield 2.30% · VIX 24.5 · 5-Yr Breakevens 2.83% · USD/JPY 158.2 · Gold $4,294
Charts
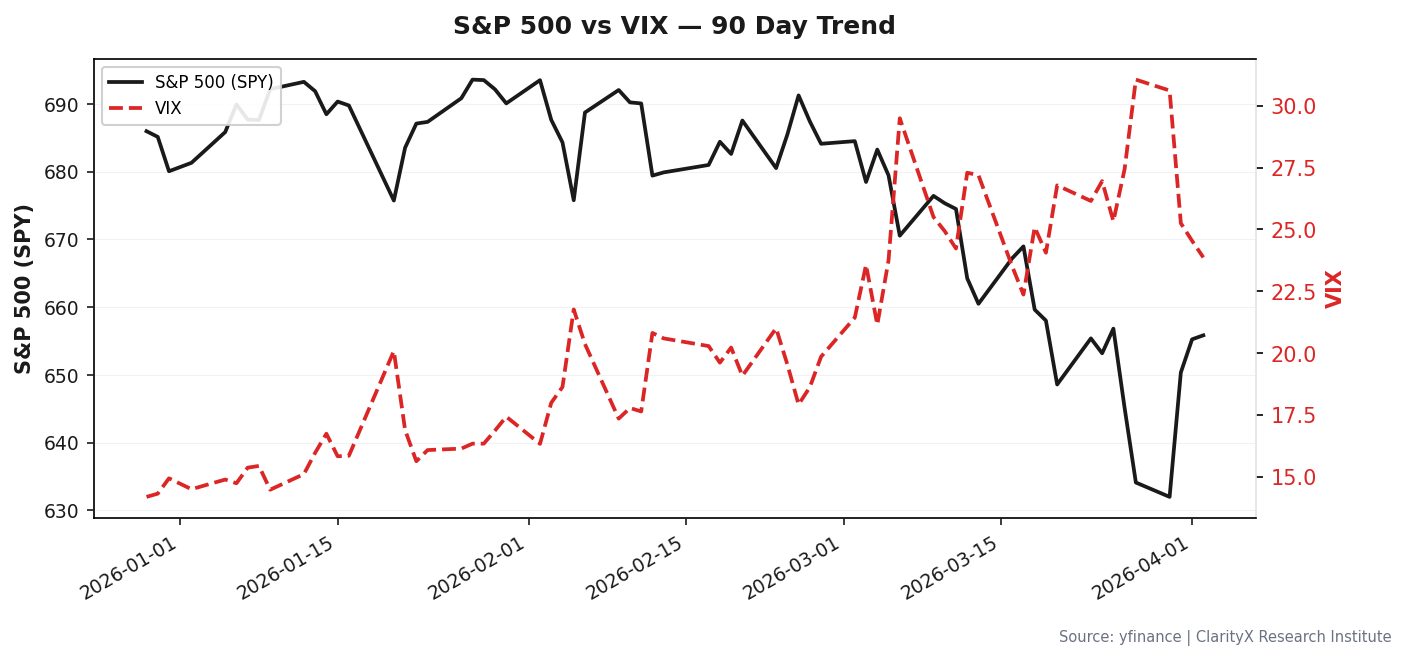 S&P 500 vs VIX — 90 Day Trend
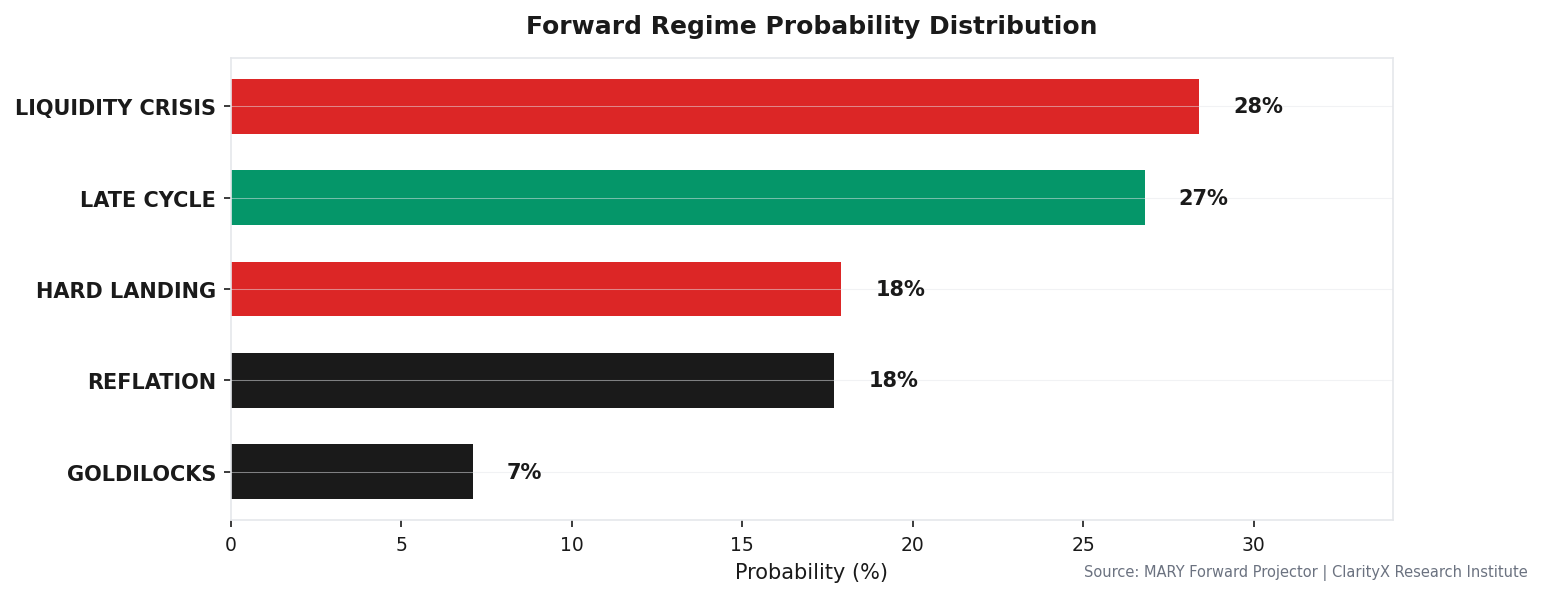 Forward Regime Probability Distribution
Data as of 2026-04-05 close. Sources: FRED, Bloomberg, ClarityX MARY. Forward risk probabilities from ClarityX regime transition model.
Get this research delivered
New analysis, directly to your inbox. Research notifications only.