CIO Weekly Intelligence Report
CIO Weekly Intelligence Report — September 16, 2026
Stagflation — Forward (within-axis): 14% chance conditions rotate toward Goldilocks; elevated
For the analytical argument, read this week's Macro Brief →
The Macro Brief concludes that the anchor holds — and it does, but the anchor is now holding in a fog. Here is the full signal picture and what we're doing about it.
The Verdict
Regime: STAGFLATION | Confidence: 41.3% | Forward Risk: STABLE
Conviction tagline: "One print from flipping — this is a coin flip, not a call."
The dominant fact this week is not the oil price or the inflation print. It is that the regime label is barely a label at all. At 41.3% confidence, STAGFLATION is a description of the last six months, not a forecast of the next six. The engine's own transition model puts roughly 36% odds on conditions resolving into a stress state — a hard landing or a liquidity crisis — within three to six months, and only 14% on a clean rotation to Goldilocks. The remaining mass sits with the status quo. When the base case could flip on a single data print, the correct posture is not to reposition aggressively in either direction. It is to hold the anchor, keep the ballast, and wait for the signal to declare itself.
First-time reader? MARY is our 16-signal regime scoring engine. It reads economic data weekly and maps conditions to historical regimes (Goldilocks, Stagflation, Late Cycle, Hard Landing) using 105 economic snapshots from 1990–2026. Confidence = how certain we are of the regime label. Probability = likelihood of a future scenario. Never swap the two.
The Evidence
Oil is the input that matters, and it has crossed the line. West Texas Intermediate (WTI) crude sits at $101.47, up from $82.17 three weeks ago — a 23% move into the triple digits, and the single largest change in the dashboard. Above $100, energy stops being a background cost and becomes a tax on the consumer and a floor under headline inflation. The signal reads SPIKE. This is the reason the stagflation label survives at all: energy prices lift the inflation side of the equation while growth slows on the other.
Inflation expectations remain unanchored — and that is the load-bearing wall. The University of Michigan inflation expectations reading is 4.6%, unchanged and above the 4.5% threshold where Fed credibility begins to erode. As of August, this is the most stagflationary number we have. If it breaks higher, the regime call firms up fast. If it rolls over, the whole thesis weakens. Everything else in this report is downstream of that single series.
Credit is calm, and that calm is the contradiction. The High-Yield Option-Adjusted Spread (HY OAS) — the extra yield investors demand to hold junk bonds over Treasuries — is 2.76%, wider by 6 basis points versus three weeks ago but still tight by any historical standard. The National Financial Conditions Index (NFCI) reads -0.56, firmly in EASY territory: liquidity is abundant and markets are functioning. Credit is telling us it believes in a soft landing. I resolve this contradiction the way I always do: credit is a coincident indicator, not a leading one. It will be the last thing to crack. Its calm is not evidence against the stagflation read — it is simply early.
The labor market is the counterweight, and it has not budged. Weekly initial jobless claims came in at 206,000, far from the 236,500 level that would signal real deterioration. Housing permits are stable at 1,433k annualized. The economy is not stagnating in the way the label implies. This is why confidence is 41% and not 70% — the stagnation half of stagflation is missing.
| Signal | Value | vs. Last Week | What It Means |
|---|---|---|---|
| WTI Crude | $101.47 | ↑ +$19.30 (worse) | Supply shock — lifts CPI while growth slows |
| Inflation Expectations (UMich) | 4.6% | → unchanged | Above 4.5% — Fed credibility eroding |
| HY OAS | 2.76% | ↑ +6bp (worse) | Still tight, but the first widening in weeks |
| NFCI | -0.56 | → unchanged | Liquidity abundant — no stress in funding markets |
| Weekly Jobless Claims | 206,000 | ↑ +7,000 (worse) | 12.9% from the recession tripwire |
Where Are We Heading?
The engine's forward model resolves growth-and-inflation conditions into one of three quadrants over the next three to six months. These are not rivals — they are the possible destinations.
| Scenario | Probability | What It Looks Like |
|---|---|---|
| Stagflation persists | 49.4% | Oil stays elevated, inflation sticky, growth flat |
| Hard Landing / Liquidity Crisis | 36.4% | Credit cracks, labor rolls over, stress overlay strikes |
| Goldilocks (growth + disinflation) | 14.2% | Oil retreats, inflation cools, growth holds |
| Total | 100% |
No trip wires are active — zero critical, zero warning. But the distance to the nearest one is what matters.
| Trigger | Threshold | Current | Distance |
|---|---|---|---|
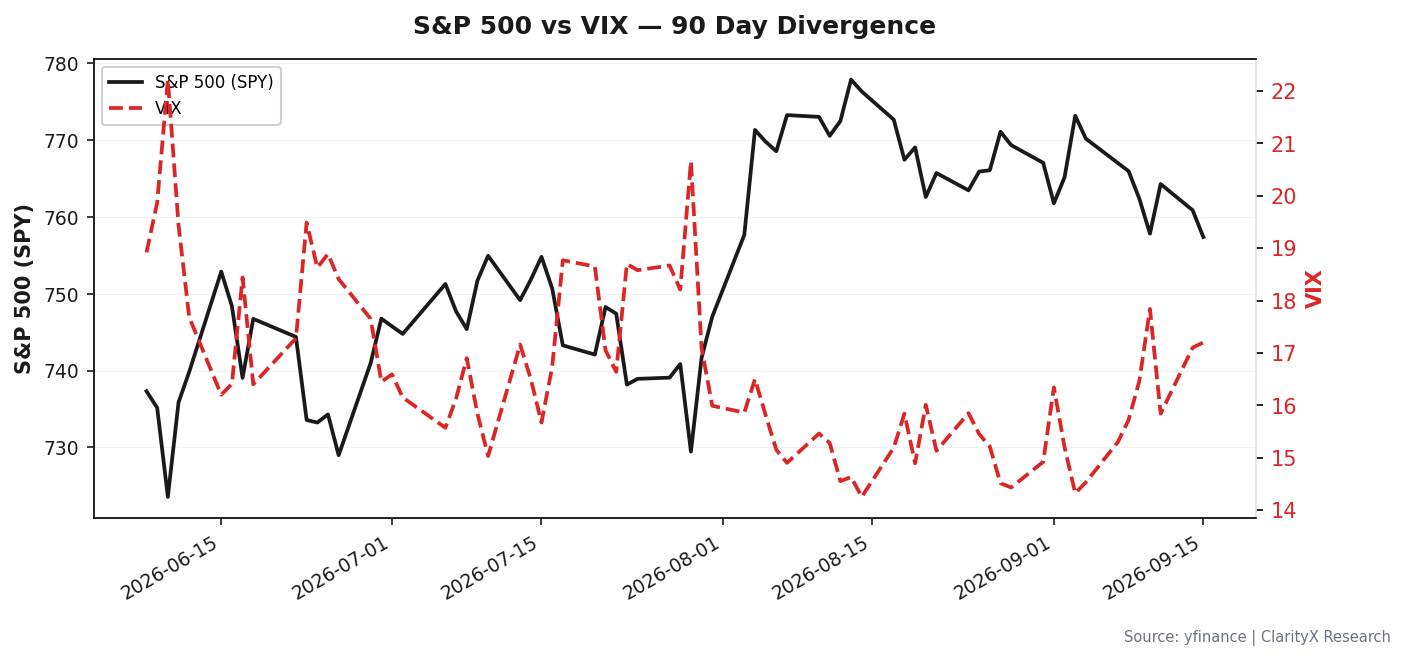
| VIX (CBOE Volatility Index) | > 35.0 for 3 days | 17.2 | Far — no fear priced |
| HY OAS | > 5.0% | 2.76% | 2.24pp — credit still calm |
| Weekly jobless claims | > 236,500 | 206,000 | 12.9% below |
| NFCI | > -0.429 | -0.56 | Tightening, not tight |
| Regime shift to HARD_LANDING or LIQUIDITY_CRISIS | Confirmed | STAGFLATION | Not triggered |
What Does History Say?
The closest analog is the 2005–06 housing bubble peak, at 79% similarity. That period's lesson is uncomfortable: quiet markets don't mean safe markets. The S&P gained 10% into the peak while the cracks — subprime lending, permit declines — were already visible to anyone looking. The second-closest analogs, 1994 and 2013, both teach the same thing: the anticipation of tightening can hurt more than the tightening itself. In all three cases, the market looked calm right up until it didn't. That is the setup we are in now.
The Entry Question
We are not in a drawdown. The S&P is near its highs, and the instinct to deploy cash aggressively here is understandable — cash earns little and the market keeps grinding up. But the engine's message is that we are in the pre-drawdown window, not the post-drawdown recovery. Deploying into a 41%-confidence regime is not conviction; it is a guess.
The staged entry framework exists for exactly this moment. Neither stage is triggered, and that is the point.
| Stage | Trigger | Why This Moment | Action |
|---|---|---|---|
| Stage 1 | VIX > 35.0 for 3 consecutive days | Fear is the signal — panic pricing creates the entry | Deploy first tranche of dry powder into equity |
| Stage 2 | HY OAS > 5.0% | Credit stress confirms the drawdown is real, not a head fake | Deploy second tranche; add quality/low-vol tilt |
The instinct to buy the dip is strongest when the dip is only half done. Right now there is no dip — only a market that hasn't decided what it is. Patience is the position.
Sector Rotation & Strategy
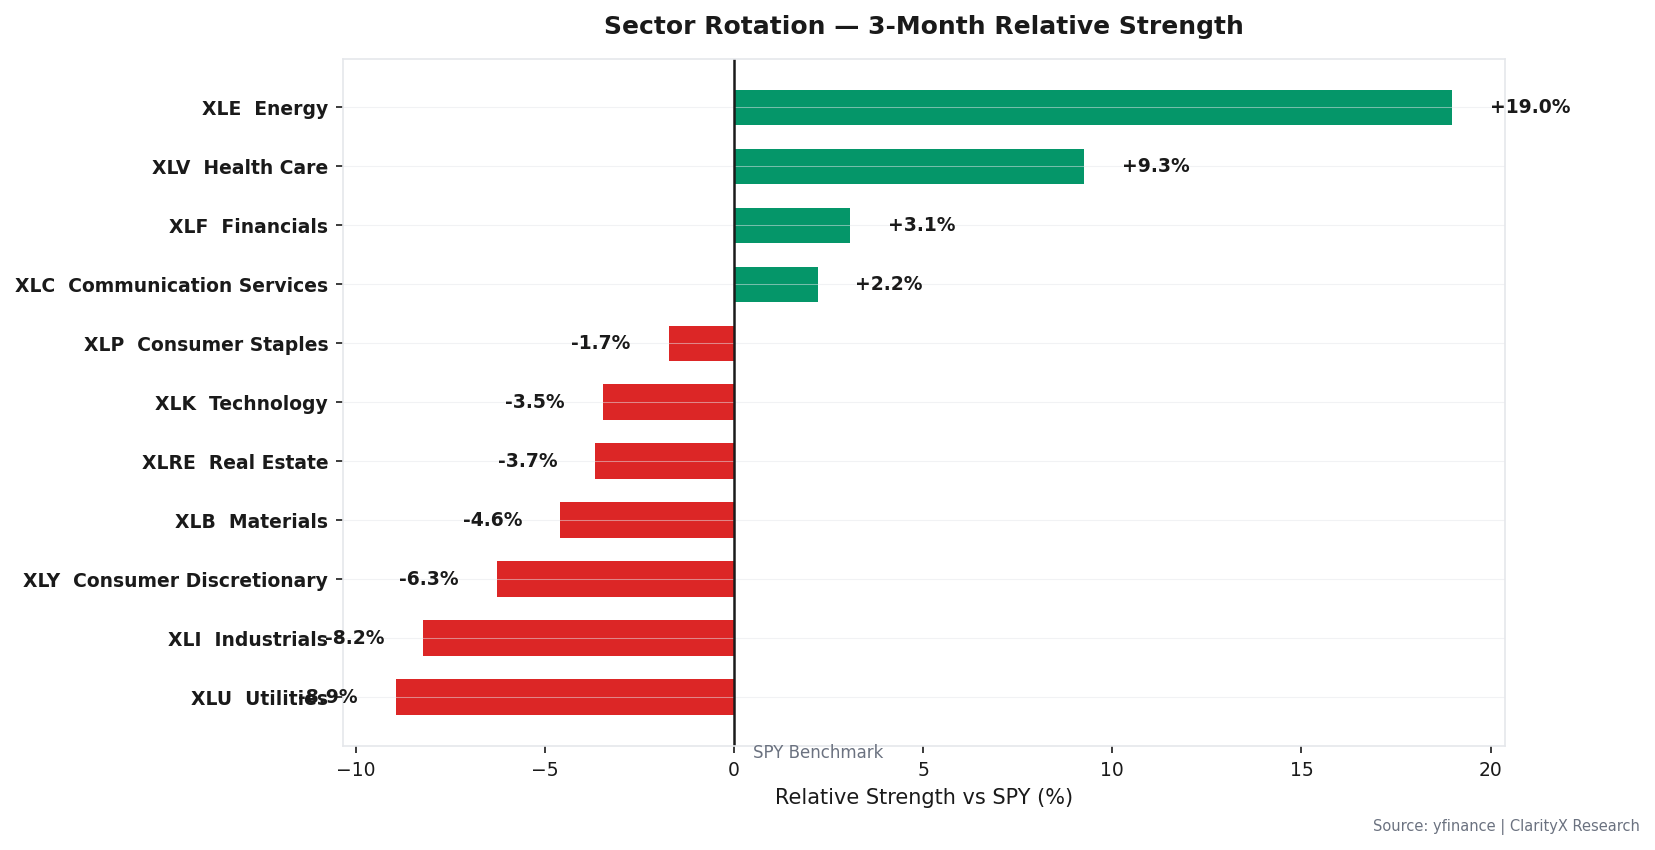
Sector leadership over the trailing three months reflects the stagflation read: energy and real assets are leading, while long-duration growth and rate-sensitive sectors lag. Within equity, the tilt remains toward pricing-power businesses — companies that can pass input costs through — and away from those that cannot.
One validated strategy fits this regime: Mean Reversion (STR-002), which posted 8.54% CAGR and a 0.39 Sharpe on Mag6 names from 2020–2024. It works best in range-bound, late-cycle markets — precisely the tape we are in. Trend-following strategies fit Goldilocks and Reflation, not here; their backtest is currently retracted and I will not cite a number for it.
The Portfolio
| Asset | Current Regime (STAGFLATION) | Target Regime (GOLDILOCKS) | Recommended Now |
|---|---|---|---|
| Equity | 60% | 85% | 61% |
| Bonds | 6% | 3% | 0% |
| REITs | 2% | 6% | 2% |
| Commodities | 8% | 2% | 8% |
| Gold | 10% | 1% | 10% |
| TIPS | 6% | 1% | 6% |
| Int'l Bonds | 2% | 1% | 2% |
| Cash | 6% | 1% | 11% |
| Total | 100% | 100% | 100% |
The recommended column keeps the strategic equity anchor at 61% — in stagflation, earnings can still grow with prices, so selling equity locks in multiple compression without capturing the inflation-driven revenue. The de-risk is the ballast: commodities, gold, and TIPS at a combined 24%, funded from bonds (cut to 0%) and cash (raised to 11%). That cash is dry powder for the staged entry above. It is not a defensive retreat; it is optionality.
The Watch List
- VIX > 35.0 for 3 consecutive days (current: 17.2) → execute Stage 1 entry.
- High-Yield Option-Adjusted Spread > 5.0% (current: 2.76%) → execute Stage 2 entry.
- Initial jobless claims (weekly) > 236,500 (current: 206,000) → tilt within equity to quality/low-vol; add bond-funded ballast (equity anchor holds).
- NFCI > -0.429 (current: -0.56) → tighten financial conditions flag.
- MARY confirms regime shift to HARD_LANDING or LIQUIDITY_CRISIS → full crisis allocation.
Options overlay: with VIX at 17.2 and the regime at 41% confidence, the engine flags a cheap tail hedge — a 10%/25% out-of-the-money SPY put spread, 90 days, costing 0.8% of portfolio. It is fire insurance: expected to expire worthless 80% of the time, but it pays off big if the 36% stress scenario lands. Monitor, don't chase.
Get this research delivered
New analysis, directly to your inbox. Research notifications only.