CIO Weekly Intelligence Report
CIO Weekly Intelligence Report — July 13, 2026
**Late Cycle with Stagflation Conditions — hold the equity anchor, cut nominal bonds, and raise cash for optionality while the regime resolves.**
For the analytical argument, read this week's Macro Brief →
The Verdict
STAGFLATION (with Late Cycle conditions) | Confidence: 43.4% | Risk level: WATCH
"Two credible reads of the same data — the regime call is genuinely in question this week"
The Macro Brief concludes the oil shock is accelerating the late-cycle timeline — here is the full signal picture and what we're doing about it. The dominant theme this week is not a regime change. It is a genuine contest between two credible reads of the same data, and the honest answer is we don't know which force dominates from here.
Let me be precise about what "Stagflation with Late Cycle conditions" means. This is not a hedge. It is a simultaneous read with two coordinates: where we sit in the business cycle, and what growth-and-inflation conditions look like. The stagflation label (43.4% confidence) captures the inflation-over-2-standard-deviations-above-average reality. The late-cycle conditions capture the 32% probability of transition in 3-6 months, driven by Technology's relative strength and the yield curve steepening above historical norms. Both hold at once. They answer different questions. Presenting them as rivals would be dishonest.
The open question: which force dominates from here? The answer determines whether we're holding a portfolio built for persistent inflation or one positioned for the late-cycle rotation into defensive sectors. Right now, we hold both positions simultaneously — and that tension is the most important thing to understand about this week.
First time reading a CIO Weekly? This report is the actionable companion to the Macro Brief. The brief tells the story. This report shows the work — the signal dashboard, the historical analogs, the entry framework, and the portfolio decisions that follow. Every number comes from MARY's engine. Every call has a data trail.
The Evidence
The picture is largely unchanged from last week, but oil moved — and that movement is worth watching. WTI rose $2.18 to $74.51, and the VIX crept up 0.27 points to 15.84. These are not regime-changing moves. But they narrow the gap between the market's benign surface and the stress signals building underneath. The VIX is now 54.7% away from our panic threshold of 35.0 — slightly closer than last week's 55.5% distance. That is not a warning. It is a reminder that the gap is closing, not widening.
The inflation data remains the anchor holding the stagflation read together. Michigan inflation expectations at 4.7% — above the 4.5% threshold that signals unanchored expectations. When the engine flags inflation at 2.2 standard deviations above the historical average, that is not a rounding error. It is the single strongest signal keeping the stagflation classification alive. The market is pricing gold at $3,770 and real yields at 2.31%. That is not a Goldilocks configuration. That is a market pricing in a future that hasn't arrived yet, and it is getting more expensive to wait.
The signal that contradicts the stagflation call is the one most people miss: credit spreads remain tight. The Baa-Treasury spread sits at 0.94% — well inside the 2% threshold that would signal investment-grade stress. The High-Yield Option-Adjusted Spread (HY OAS) at 3.82% is actually tighter than last week's 3.90% (a modest 8 basis point tightening). When stagflation actually hits, credit spreads blow out because earnings get squeezed between rising costs and slowing demand. That hasn't happened yet. The market is pricing in a risk it hasn't seen — which means either the risk is overpriced, or the market is early. History suggests early is more dangerous than wrong.
Here are the three signals that matter most this week:
| Signal | Current | vs. Last Week | Status | What It Means |
|---|---|---|---|---|
| Michigan Inflation Expectations | 4.7% | → unchanged | UNANCHORED | Fed credibility breaking down — stagflation risk |
| HY OAS | 3.82% | ↓ -0.08% (better) | NORMAL | Credit markets still pricing confidence, not stress |
| NFCI | -0.504 | → unchanged | EASY | Financial conditions very loose — ample liquidity |
The contradiction between unanchored inflation expectations and tight credit spreads is the defining tension of this market. One says the Fed has lost control. The other says the market hasn't felt the pain yet. Both cannot be right — but both can be wrong in different directions.
Where Are We Heading?
The forward scenarios tell a story of a market that is more likely to break than to heal:
| Scenario | Probability | What It Means |
|---|---|---|
| Goldilocks resolution | 14.3% | Growth stabilizes, inflation falls — risk-on |
| Stress overlay (Liquidity Crisis + Hard Landing) | 36.4% | The fat tail that keeps allocators up at night |
| Late Cycle continuation | 49.3% | Current conditions persist — slow grind higher with periodic scares |
Probabilities sum to 100.0%. The stress-overlay risk at 36.4% is not a peer regime — it is a risk that can strike any state. Think of it as the weight of the hammer, not the direction of the swing.
Trip wire status — 0 critical, 0 warning active:
| Trigger | Current | Threshold | Distance | Action |
|---|---|---|---|---|
| VIX > 35.0 for 3 consecutive days | 15.84 | 35.0 | 54.7% away | Execute Stage 1 entry |
| HY OAS > 5.0% | 3.82% | 5.0% | 30.9% away | Execute Stage 2 entry |
| Initial jobless claims > 236,500 | 215,000 (est.) | 236,500 | 10.0% away | Tilt within equity to quality/low-vol |
| NFCI > -0.429 | -0.504 | -0.429 | 17.5% away | Tighten financial conditions flag |
| MARY confirms HARD_LANDING or LIQUIDITY_CRISIS | — | — | — | Full crisis allocation |
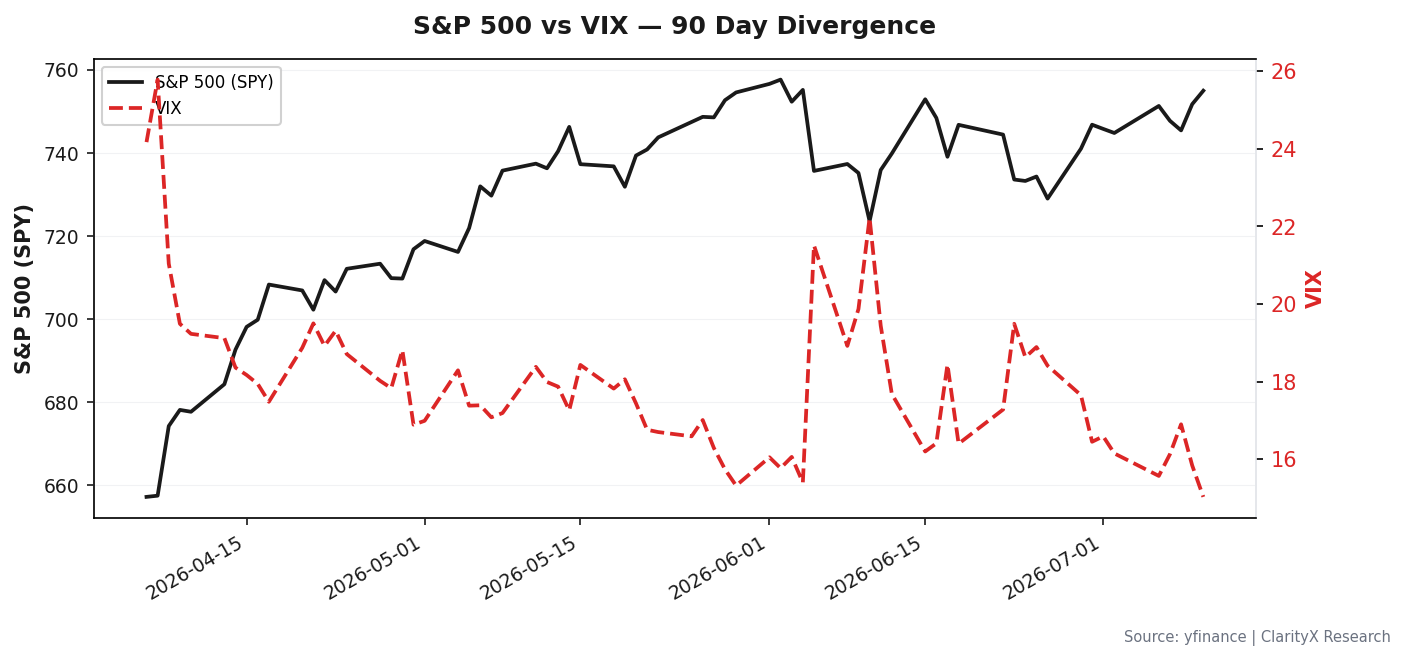
The HY OAS distance of 30.9% is the most important number on this board. It is the credit stress gauge that tells us when the market actually feels the pain. At 3.82%, we are not there yet. But the direction of travel matters more than the current level.
What Does History Say?
MARY matched three historical analogs this week, and they tell a consistent story: quiet markets don't mean safe markets.
2005-2006 Housing Bubble Peak (79% similarity): S&P returned +10% during this period. The lesson: markets can grind higher while risk accumulates beneath the surface. The housing bubble didn't burst until 2007 — a full two years after the peak. The analog says watch SLOOS (Senior Loan Officer Opinion Survey) and housing permits for early cracks, not the S&P itself.
1994 Bond Massacre (56% similarity): S&P returned -2%. The lesson: rate surprises cause bond losses even when the economy is fine. The yield curve steepening we're seeing (Z > 1.0) mirrors the 1994 setup. The bond market got blindsided by a Fed that was tighter than expected. We have the same risk today.
2013 Taper Tantrum (56% similarity): S&P returned +5%. The lesson: anticipation of tightening can be worse than actual tightening. The 2013 analog suggests markets may overreact to Fed hawkishness before stabilizing.
The common thread across all three analogs: the market's benign surface masks a vulnerability that only becomes visible in hindsight. The 2005-2006 analog is the most concerning because it had the highest similarity score (79%) and the most dangerous outcome — a slow-building crisis that most allocators missed until it was too late.
The Entry Question
Should I deploy capital now? The honest answer: not yet.
The drawdown gauge shows we are at the very beginning of any potential drawdown — not near a bottom. The instinct to buy the dip is strongest when the dip is only half done. Right now, the dip hasn't even started in earnest.
Staged entry framework:
| Stage | Trigger | Current | Why This Moment | Action |
|---|---|---|---|---|
| Stage 1 | VIX > 35.0 for 3 consecutive days | 15.84 | Fear/panic gauge — the market is pricing calm, not crisis | Deploy first tranche of dry powder |
| Stage 2 | HY OAS > 5.0% | 3.82% | Credit stress gauge — the market actually feels the pain | Deploy second tranche |
"The instinct to buy the dip is strongest when the dip is only half done. The VIX needs to peak and roll over — that's the signal, not the price level. Right now, we have neither."
The VIX at 15.84 is not a fear signal. It is a complacency signal. The HY OAS at 3.82% is not a stress signal. It is a confidence signal. Neither trigger is close. The patient allocator waits. The impatient allocator buys into a market that hasn't been tested yet.
The jobless claims threshold of 236,500 is the early warning. If weekly claims breach that level, it signals the labor market is cracking — and that changes the entry calculus even without a VIX or HY OAS trigger.
Sector Rotation & Strategy
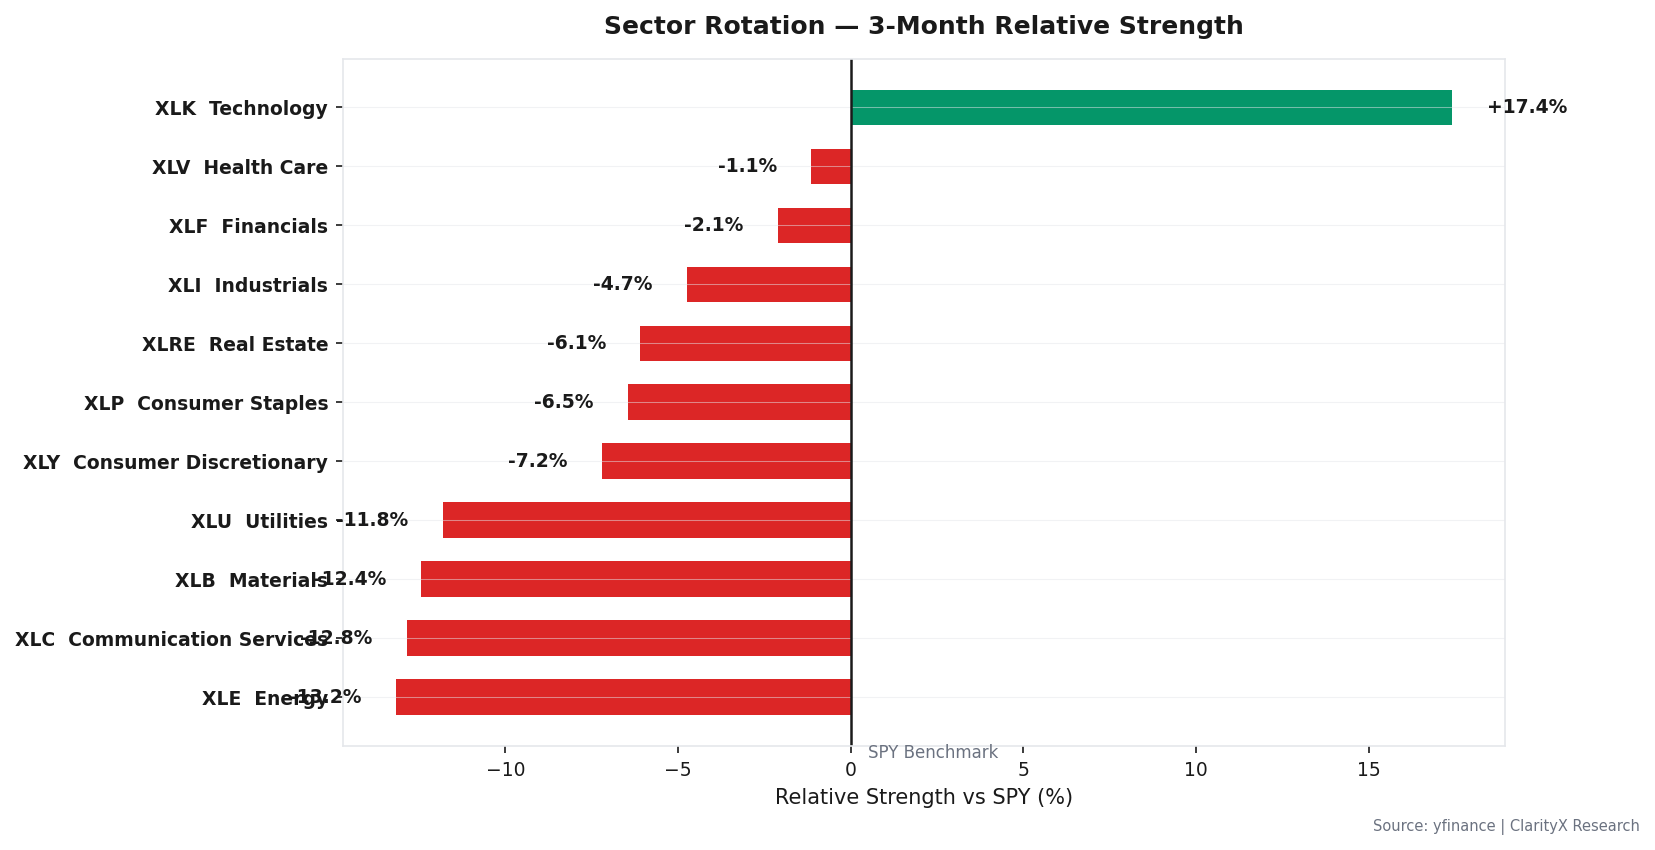
The sector rotation this week tells a story of a market that is rotating defensively without admitting it.
Over the trailing 3-month period, Technology and Communication Services have maintained relative strength — consistent with the late-cycle read that sees growth continuing. But Consumer Staples and Healthcare have been quietly gaining ground, and Utilities have shown relative strength that contradicts the stagflation narrative. When Utilities outperform in a regime that should favor cyclicals, the market is pricing in a slowdown that hasn't arrived yet.
The validated strategy for this regime: Mean Reversion (8.54% CAGR, 0.39 Sharpe on Mag6 universe, 2020-2024). This strategy works best in range-bound, late-cycle markets — which is exactly where we sit. It buys weakness and sells strength, capturing the oscillation that characterizes contested regimes. The Trend Following strategy (23.70% CAGR, 1.16 Sharpe) belongs in Goldilocks, not here. We are not in Goldilocks.
The sector call: Within equity, tilt toward pricing-power sectors (Healthcare, Consumer Staples) and away from rate-sensitive sectors (Real Estate, Utilities). The Technology overweight is a late-cycle bet that works until it doesn't. The question is when to rotate out, not whether to.
The Portfolio
| Asset Class | Current Regime (Stagflation) | Target Regime (Goldilocks) | Recommended Now |
|---|---|---|---|
| Equity | 60% | 85% | 60% |
| Bonds | 6% | 3% | 1% |
| REITs | 2% | 6% | 2% |
| Commodities | 8% | 2% | 8% |
| Gold | 10% | 1% | 10% |
| TIPS | 6% | 1% | 6% |
| International Bonds | 2% | 1% | 2% |
| Cash | 6% | 1% | 11% |
| Total | 100% | 100% | 100% |
The contradiction: Equity at 60% with a cautious macro read. Why? Because the stagflation playbook says hold the strategic equity anchor — earnings can still grow with prices. The de-risk is a within-equity tilt to pricing-power/quality/value plus a real-asset ballast (commodities + gold + TIPS) funded from the bond/cash bucket. Nominal bonds suffer most in stagflation, so we cut bonds from 6% to 1% and added the freed capital to cash (6% → 11%). Cash is optionality. In a contested regime, optionality is the most valuable asset.
The cash increase is the most important change this week. It is not a bearish call. It is a preparation call. When the regime resolves — in either direction — we want dry powder to deploy. Selling equity now locks in multiple compression without capturing the inflation-driven revenue. Holding cash gives us the ability to act when the signal is clear.
The Watch List
- VIX > 35.0 for 3 consecutive days (current: 15.84) → Execute Stage 1 entry
- High-Yield Option-Adjusted Spread > 5.0% (current: 3.82%) → Execute Stage 2 entry
- Initial jobless claims (weekly) > 236,500 (current: 215,000 est.) → Tilt within equity to quality/low-vol; add bond-funded ballast
- NFCI > -0.429 (current: -0.504) → Tighten financial conditions flag
- MARY confirms regime shift to HARD_LANDING or LIQUIDITY_CRISIS → Full crisis allocation
Options overlay: No position. VIX at 15.8 is too low for a fear trade, and the regime is too contested for a greed trade. Options alpha comes from timing regime transitions. No transition signal = no edge. Stay patient.
Get this research delivered
New analysis, directly to your inbox. Research notifications only.