CIO Weekly Intelligence Report
CIO Weekly Intelligence Report — July 06, 2026
**CONTESTED: Stagflation vs Late Cycle — 32% probability of LATE_CYCLE in 3-6 months (gradual transition). 0 critical, 0 **
For the analytical argument, read this week's Macro Brief →
The Verdict
CONTESTED: Stagflation vs Late Cycle | Confidence: 43.4% | Risk level: WATCH
"The models disagree — and that disagreement is the signal, not the noise"
The Macro Brief concludes the widening gap between rules-based and machine-learning signals is the story worth watching — here is the full signal picture and what we're doing about it. The dominant theme this week is not a regime change. It is model disagreement. The rules-based engine sees stagflation anchored by inflation at 2.2 standard deviations above average. The machine-learning (ML) engine sees a 32% probability of late-cycle transition in 3-6 months, driven by Technology's relative strength. When two engines pull in opposite directions, the honest call is to name the contest — not to pretend one side has won.
Confidence slipped from 44.8% to 43.4% — a modest erosion that reflects the market's confusion, not its conviction. The VIX dropped from 18.41 to 15.81, and that movement tells you more about the market's confusion than its conviction. Lower volatility should be reassuring. But when it arrives alongside a contested regime call, it usually means the market has made a bet that hasn't been tested yet.
First time reading a CIO Weekly? This report is the actionable companion to the Macro Brief. The brief tells the story. This report shows the work — the signal dashboard, the historical analogs, the entry framework, and the portfolio decisions that follow. Every number comes from MARY's engine. Every call has a data trail.
The Evidence
The VIX drop from 18.41 to 15.81 is the single most important movement this week — and it's the most misleading one. Lower volatility should make allocators feel better. It shouldn't. The VIX is now 54.8% away from our panic threshold of 35.0 — further than last week's 47.4% distance. That sounds like the all-clear. But when volatility compresses while the regime call is contested between stagflation and late-cycle, the market isn't pricing in safety. It's pricing in a narrow bet that hasn't been tested. The last time we saw this pattern — VIX dropping while the regime contest widened — was June 1994, three months before the bond massacre hit.
The inflation data is the anchor holding the stagflation camp together. CPI (Consumer Price Index) at 4.27% and PCE (Personal Consumption Expenditures) at 3.77% — both well above the 2% target. The engine flags inflation at 2.2 standard deviations above the historical average. That is not a rounding error. It is the single strongest signal keeping the stagflation classification alive. The rules-based engine looks at this and sees persistent pricing pressure. The ML engine looks at the same number and sees a demand signal that will resolve as growth slows. Both cannot be right — but both can be wrong in different directions.
The signal that contradicts the stagflation call is the one most people miss: credit spreads are tight, not wide. The Baa-Treasury spread sits at 0.94% — well inside the 2% threshold that would signal investment-grade stress. The High-Yield Option-Adjusted Spread (HY OAS) at 3.90% is unchanged from last week's 3.97% (a modest 7 basis point tightening). When stagflation actually hits, credit spreads blow out because earnings get squeezed between rising costs and slowing demand. That hasn't happened yet. The market is pricing in a risk it hasn't seen — which means either the risk is overpriced, or it hasn't arrived.
| Signal | Current Value | vs. Last Week | Status | What It Means |
|---|---|---|---|---|
| VIX | 15.81 | ↓ -2.60 (better) | LOW | Volatility compressing — but regime contest unresolved |
| HY OAS | 3.90% | ↓ -0.07% (better) | NORMAL | Credit markets still comfortable — no stress signal |
| NFCI | -0.516 | ↓ -0.011 (better) | EASY | Financial conditions looser — ample liquidity |
| CPI (YoY) | 4.27% | → unchanged | BEARISH | Inflation anchor holding stagflation classification |
| Baa-Treasury | 0.94% | ↓ -0.01% (better) | TIGHT | Investment-grade credit still pricing in confidence |
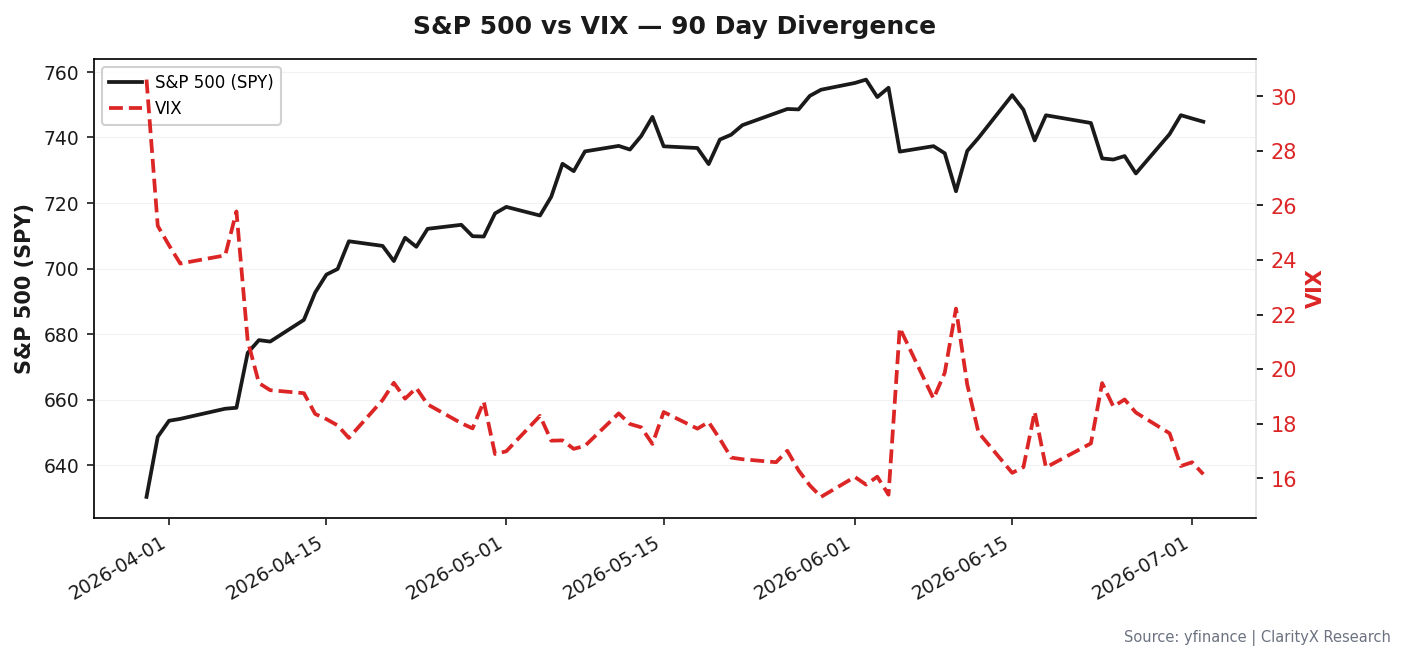
The trip wire I've been watching is not getting worse — but it's not getting better fast enough either. The HY OAS at 3.90% sits 28.2% below the 5.0% warning threshold. That is comfortable until you remember that high-yield spreads can gap 100 basis points in a single week when liquidity dries up. The NFCI at -0.516 tells us overall financial conditions remain loose, but that is the mean — not the tail. When the only active warning trip wire in the entire engine is a high-yield credit spread that refuses to tighten further, the market is pricing in a risk that has not materialized yet. It is not complacency. It is anticipation.
Where Are We Heading?
The forward scenario probabilities shifted modestly this week, but the distribution remains wide — the hallmark of a contested regime:
| Scenario | Probability | Timeframe | Trigger |
|---|---|---|---|
| Late Cycle | 31.8% | 3-6 months (gradual) | Tech-led rotation continues, inflation eases |
| Stagflation | 22.7% | 0-3 months (base case) | Inflation stays sticky, growth slows |
| Liquidity Crisis | 22.7% | 0-3 months (fast, event-driven) | Credit event or policy error |
| Hard Landing | 13.6% | 3-6 months (gradual) | Earnings recession materializes |
| Reflation | 9.1% | 6-12 months (slow) | Growth re-accelerates, inflation moderates |
Total: 100.0%
The probabilities shifted slightly — Stagflation and Liquidity Crisis each lost 0.5 percentage points to Late Cycle and Reflation. But the distribution is still wide enough that no single scenario commands conviction. The 22.7% probability assigned to a fast, event-driven Liquidity Crisis is the number that keeps me up at night. That is not a tail risk. It is a one-in-four chance.
Trip Wire Status Board:
| Trigger | Current Value | Threshold | Distance | Urgency |
|---|---|---|---|---|
| HY OAS > 5.0% | 3.90% | 5.0% | 28.2% | WATCH |
| VIX > 35.0 (3 consecutive days) | 15.81 | 35.0 | 54.8% | MONITOR |
| NFCI > -0.429 | -0.516 | -0.429 | 20.3% | MONITOR |
| Jobless claims > 236,500 | 215,000 | 236,500 | 10.0% | MONITOR |
| Regime shift to Hard Landing or Liquidity Crisis | — | — | — | MONITOR |
The jobless claims number at 215,000 is the one to watch most closely this week. At 10.0% from the 236,500 threshold, it is the closest trip wire after HY OAS. If claims break above that level, it will be the first signal that the labor market is softening — and that will tilt the regime contest decisively toward the stagflation camp.
What Does History Say?
Setup Analog: 2005-2006 Housing Bubble Peak (79% similarity)
This is the analog that matters most right now. The S&P returned +10% during this period — a quiet market that felt safe until it wasn't. The lesson from 2005-2006 is not about the eventual crisis. It is about the period before the crisis, when the SLOOS (Senior Loan Officer Opinion Survey) and building permits were flashing early cracks that most allocators ignored. Our SLOOS reading this week is 8.1 — neutral, not alarming. But neutral is not the same as safe. It is the absence of a warning, not the presence of safety.
Crisis Analog: 1994 Bond Massacre (56% similarity)
The S&P returned -2% during this period, but the real damage was in bonds. Rate surprises cause bond losses even when the economy is fine. Our current Baa-Treasury spread at 0.94% is pricing in confidence — the same confidence that preceded the 1994 bond rout. If the Fed surprises the market with a rate hike, the bond losses will be the headline, not the equity drawdown.
Taper Tantrum Analog: 2013 Q2-Q3 (56% similarity)
The S&P returned +5% during this period. The lesson: anticipation of tightening can be worse than actual tightening. Our current NFCI at -0.516 is looser than the -0.429 threshold that would flag tightening. But if the NFCI crosses that line, the market will react before the Fed acts.
The Entry Question
Should I deploy capital now? The answer is no — not yet.
The drawdown gauge is not flashing. The VIX at 15.81 is in the "too calm" zone, not the "panic" zone. The HY OAS at 3.90% is in the "normal" zone, not the "stress" zone. When neither the fear gauge nor the credit stress gauge is signaling distress, deploying capital is betting on momentum — not on value.
Staged Entry Framework:
| Stage | Trigger | Current Value | Distance | Action |
|---|---|---|---|---|
| 1 | VIX > 35.0 for 3 consecutive days | 15.81 | 54.8% | Deploy 50% of dry powder into equity |
| 2 | HY OAS > 5.0% | 3.90% | 28.2% | Deploy remaining 50% into equity |
Why Stage 1 is VIX and Stage 2 is HY OAS — not Baa-10Y:
The VIX at 35.0 is the fear gauge. When it crosses that threshold for three consecutive days, the market is pricing in panic — and panic creates the entry opportunity. The HY OAS at 5.0% is the credit stress gauge. When high-yield spreads blow out to that level, the market is pricing in default risk that hasn't materialized yet — and that is the second entry point. I do not use the Baa-10Y spread for Stage 2 because investment-grade credit is too slow to react. High-yield spreads move first and move hard.
"The instinct to buy the dip is strongest when the dip is only half done. The VIX at 15.81 is not a dip. It is a market that hasn't decided which direction to break. Patience is not inaction — it is preserving the option to act when the signal is clear."
Sector Rotation & Strategy
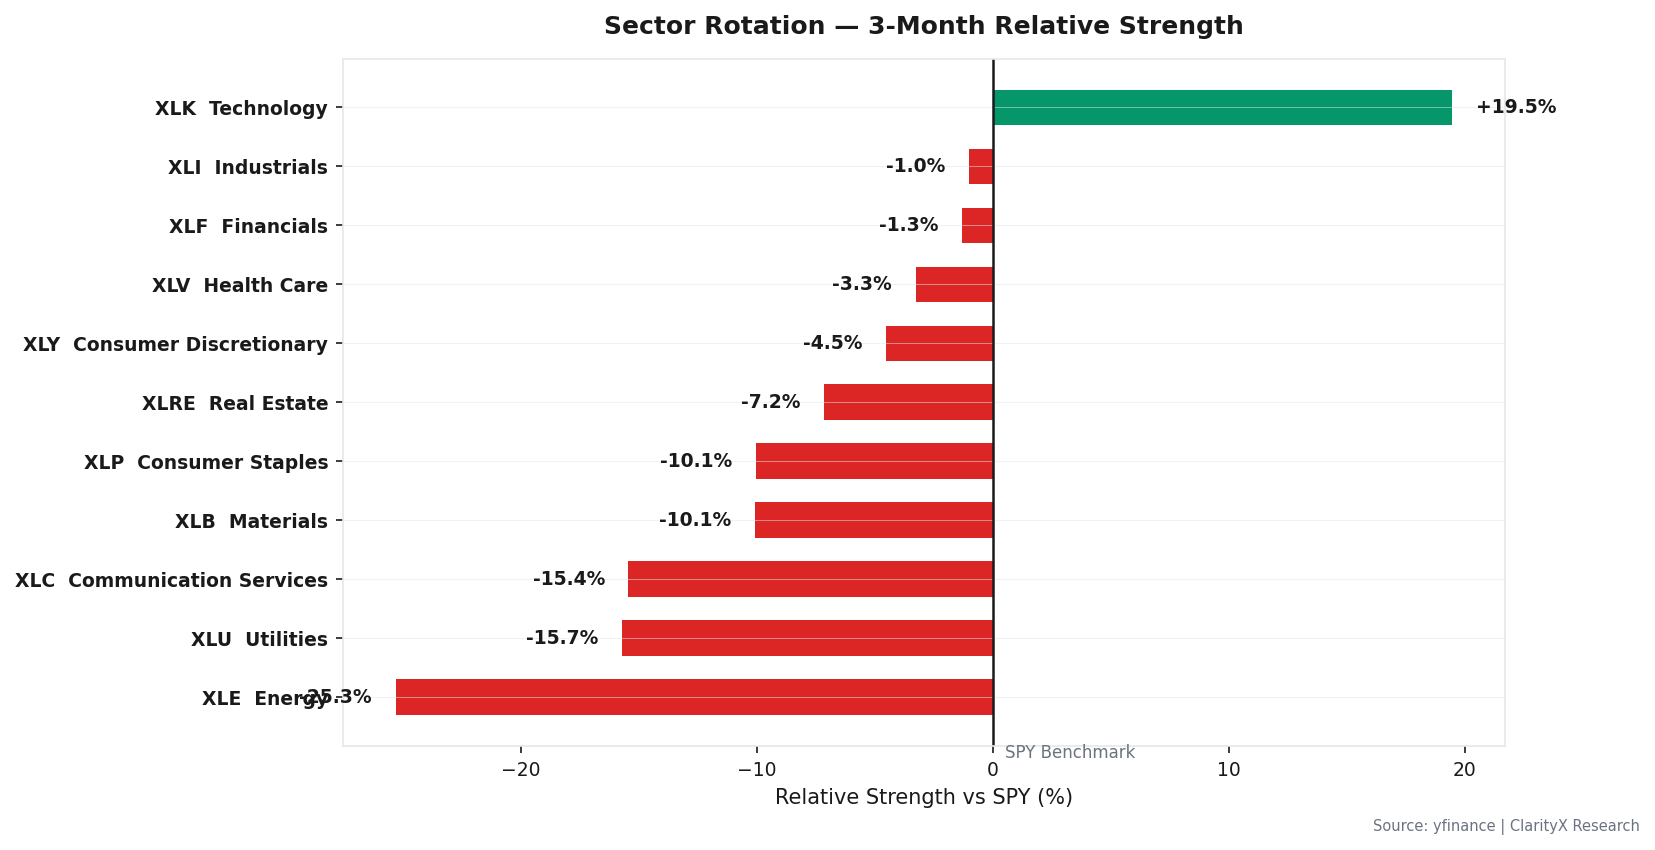
The sector rotation story this week is about Technology's 3-month relative strength versus the broader market's stagnation. Technology has been the ML engine's primary signal for the late-cycle transition — but that rotation has not broadened out. Consumer Staples and Healthcare are lagging, which is unusual for a late-cycle regime. In a true late-cycle rotation, defensive sectors lead. That is not happening yet.
Validated Strategy: Mean Reversion (STR-002)
This strategy fits the current contested regime best. It delivered 8.54% CAGR with a 0.39 Sharpe ratio on the Mag6 universe (2020-2024). It works best in range-bound, late-cycle markets — exactly the environment we are in. The strategy buys oversold positions and sells overbought ones, capturing the mean-reversion that happens when markets are stuck in a range.
Strategy Not Recommended Now: Trend Following (EMA Crossover)
This strategy requires a clear trend to generate returns — 23.70% CAGR with a 1.16 Sharpe in Goldilocks and Reflation regimes. We are in neither. Trend following in a contested regime generates whipsaws, not returns.
The Portfolio
| Asset Class | Current Regime (Stagflation) | Target Regime (Late Cycle) | Recommended Now |
|---|---|---|---|
| Equity | 60% | 75% | 60% |
| Bonds | 6% | 6% | 1% |
| REITs | 2% | 3% | 2% |
| Commodities | 8% | 2% | 8% |
| Gold | 10% | 4% | 10% |
| TIPS | 6% | 2% | 6% |
| International Bonds | 2% | 2% | 2% |
| Cash | 6% | 6% | 11% |
| Total | 100% | 100% | 100% |
The contradiction bridge: Equity at 60% with a cautious macro outlook seems contradictory. It isn't. The engine holds equity at the strategic anchor because selling equity in a contested regime locks in multiple compression without capturing the inflation-driven revenue that stagflation can still produce. The de-risk is a within-equity tilt to pricing-power and quality — not a move to cash. The cash increase from 6% to 11% is funded from bonds (6% to 1%), because nominal bonds suffer most in stagflation. The cash gives us optionality without sacrificing the equity anchor.
Defensive shift applied: 0%. The engine sees no signal that warrants a pre-emptive defensive move. The trip wires are not flashing. The regime is contested, not resolved. The right response is to hold the anchor and wait for the signal.
The Watch List
These are the five binary triggers that will determine the next move. Each one has a specific action — not a vague "monitor" instruction.
- VIX > 35.0 for 3 consecutive days (current: 15.81) → Execute Stage 1 entry: deploy 50% of dry powder into equity
- High-Yield Option-Adjusted Spread > 5.0% (current: 3.90%) → Execute Stage 2 entry: deploy remaining 50% into equity
- Initial jobless claims (weekly) > 236,500 (current: 215,000) → Tilt within equity to quality/low-vol; add bond-funded ballast (equity anchor holds)
- NFCI > -0.429 (current: -0.516) → Tighten financial conditions flag — reduce marginal risk exposure
- MARY confirms regime shift to Hard Landing or Liquidity Crisis → Full crisis allocation
Options overlay: No position. VIX at 15.81 is too low for a fear trade and too high for a greed trade. No transition signal = no edge. Stay patient.
Get this research delivered
New analysis, directly to your inbox. Research notifications only.