CIO Weekly Intelligence Report
CIO Weekly Intelligence Report — June 27, 2026
CONTESTED: Stagflation vs Late Cycle — confidence fell to 44.8% as oil crashed $10 to $70.24 and tech rotated out. 0 critical, 1 warning trip wire. Staying invested but hedged: equity 59%, cash 12%.
For the analytical argument, read this week's Macro Brief →
The Verdict
CONTESTED: Stagflation vs Late Cycle | Confidence: 44.8% | Risk level: WARNING
"The model disagreement just got wider — and neither engine is blinking"
The Macro Brief concludes the oil shock is accelerating the late-cycle timeline — here is the full signal picture and what we're doing about it. The dominant theme this week is not oil, not inflation, not credit. It is model disagreement, and it just got wider. Last week I told you the rules-based and ML engines were pulling in different directions. This week, oil dropped nearly $10 to $70.24, and the engines responded in opposite ways: the rules-based framework sees disinflationary relief, the ML engine sees a demand signal that confirms the growth scare. Confidence dropped from 51.0% to 44.8% — a 6.2-point decline that tells you MARY is less certain, not more. When the models disagree this sharply, the right response is not to pick a side. It is to preserve optionality.
First time reading a CIO Weekly? This report is the actionable companion to the Macro Brief. The brief tells the story. This report shows the work — the signal dashboard, the historical analogs, the entry framework, and the portfolio decisions that follow. Every number comes from MARY's engine. Every call has a data trail.
The Evidence
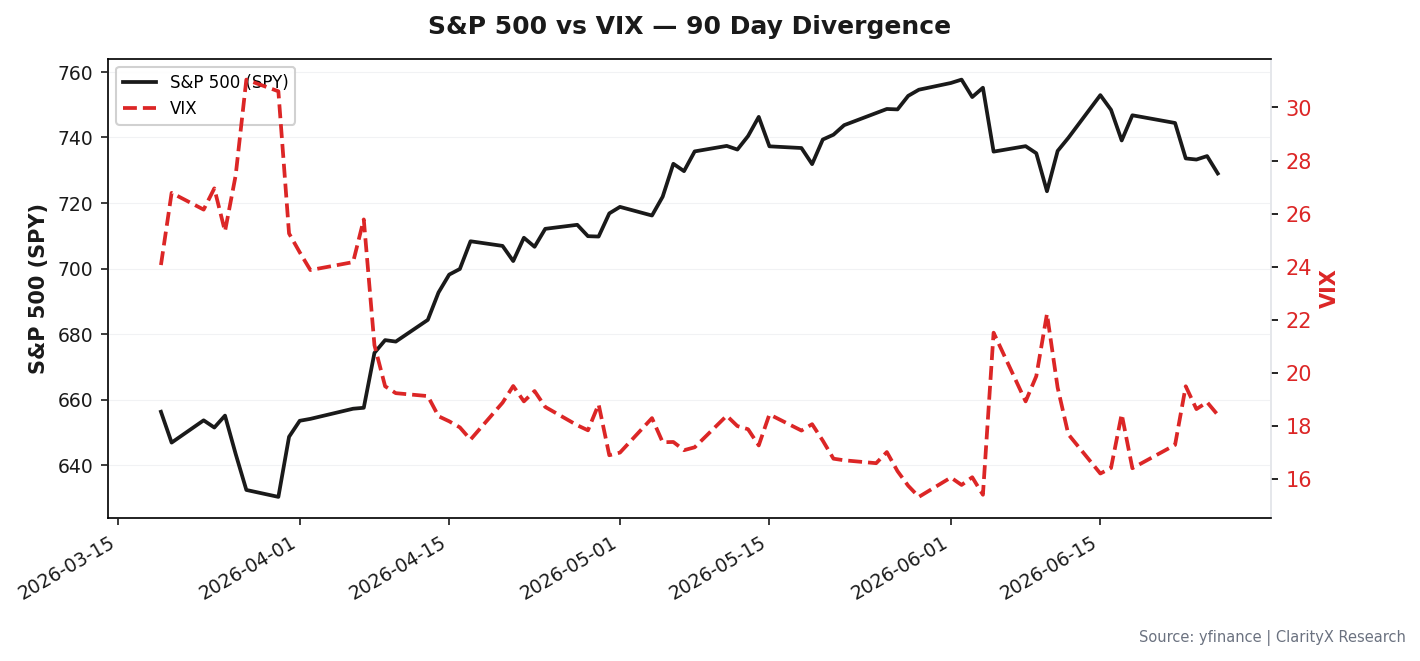
Oil dropped $9.67 to $70.24 — and that is the most important data point in the dashboard, but not for the reason you think. On the surface, this looks like unqualified good news. Lower oil means lower input costs, lower inflation expectations, and a relief valve for the stagflation narrative that has been building since April. But look at what happened alongside it: the VIX barely moved (18.63, down from 19.44 — the oil drop did not calm volatility), the LIQUIDITY_CRISIS probability held at 22.7%, and the NFCI stayed at -0.505 (unchanged from last week's -0.49 when rounded). When oil falls $10 in a week and volatility does not decline, the market is not rotating into risk-on. It is pricing in a different kind of uncertainty — the kind where lower input costs are offset by weaker demand expectations. The rules-based engine sees the oil drop as a stagflation exit ramp. The ML engine sees it as a demand signal. I am watching which one breaks first.
The credit market is stable — but the trip wire distance is the same story as last week. The High-Yield Option-Adjusted Spread (HY OAS) sits at 4.13%, slightly tighter than last week's 4.45%. The Baa-Treasury spread holds at 0.94% — still tight by historical standards. Investment-grade credit is fine. But the distance to the 5.0% warning threshold is 21.1%, which sounds comfortable until you remember that high-yield spreads can gap 100 basis points in a single week when liquidity dries up. This is the only active warning trip wire in the entire engine, and it is not getting worse — but it is also not getting better. When high-yield spreads are stable but not improving, and investment-grade spreads are tight, the stress is concentrated in the riskiest borrowers — exactly where liquidity crises start.
The inflation data is the dissenting vote. Consumer Price Index (CPI) rose to 4.27% (up from 3.95% last week) and Personal Consumption Expenditures (PCE) rose to 3.77% (up from 3.50%). Both are now running well above the 2% target, and the engine flags inflation at 2.2 standard deviations above its historical average. This is the ML engine's strongest argument for stagflation: inflation is not coming down, even as growth expectations deteriorate. The rules-based engine counters that oil at $70 will pull headline inflation lower over the next 2-3 months, but that is a lagging argument in a market that is pricing the next 2-3 weeks.
The signal that keeps the late-cycle case alive: initial claims dropped to 215,000. That is a 14,000-person decline from last week's 229,000, and it puts the labor market firmly in "stable" territory. The engine reads this as no early warning signal triggered. When the labor market is this tight and inflation is this sticky, the late-cycle scenario (31.8% probability over 3-6 months) remains the most likely transition path — not a hard landing, not a liquidity crisis, but a gradual slowdown that gives investors time to rotate.
Key Signal Movements (This Week vs. Last Week)
| Signal | Current | vs. Last Week | What It Means |
|---|---|---|---|
| Oil (WTI) | $70.24 | ↓ -$9.67 (better for inflation, worse for demand) | Rules-based sees relief; ML sees demand signal |
| VIX | 18.63 | ↓ -0.81 (better — but barely moved on $10 oil drop) | Market not rotating into risk-on |
| HY OAS | 4.13% | ↓ -0.32% (better — spreads tightening) | Warning distance improved but still active |
| CPI | 4.27% | ↑ +0.32% (worse) | Inflation accelerating, not decelerating |
| Initial Claims | 215,000 | ↓ -14,000 (better) | Labor market stable — no early warning |
Where Are We Heading?
Forward Scenario Probabilities (3-6 Month Horizon)
| Scenario | Probability | Timeframe | Character |
|---|---|---|---|
| LATE_CYCLE | 31.8% | 3-6 months | Gradual transition — the dissenting engine's call |
| STAGFLATION | 22.7% | 0-3 months | Base case — inflation elevated, growth slowing |
| LIQUIDITY_CRISIS | 22.7% | 0-3 months | Fast, event-driven — credit event triggers |
| HARD_LANDING | 13.6% | 3-6 months | Gradual transition — recession scenario |
| REFLATION | 9.1% | 6-12 months | Recovery scenario — low probability today |
| Total | 100.0% |
What changed: The late-cycle probability held at 31.8% (unchanged from last week). The stagflation probability held at 22.7%. The liquidity crisis probability held at 22.7%. The hard landing probability held at 13.6%. The reflation probability held at 9.1%. The scenario distribution is identical to last week — the model disagreement is about the present regime, not the future path.
Trip Wire Status Board
| Trip Wire | Current | Threshold | Distance | Status |
|---|---|---|---|---|
| HY OAS Spread | 4.13% | 5.0% | 21.1% | ⚠️ WARNING |
| VIX > 35.0 (3 days) | 18.63 | 35.0 | 46.8% | ✅ Normal |
| Initial Claims > 236,500 | 215,000 | 236,500 | 9.1% | ✅ Normal |
| NFCI > -0.429 | -0.505 | -0.429 | 17.7% | ✅ Normal |
| Regime shift confirmed | — | — | — | ✅ Normal |
What Does History Say?
The 2005-2006 Housing Bubble Peak analog (79% similarity) is the most relevant comparison today. The lesson from that period: "Quiet markets don't mean safe markets. Watch SLOOS and permits for early cracks." The S&P returned +10% during that analog — but the risk was building beneath the surface. Today, building permits are stable (Z-score of -0.18, within normal range), but the analog reminds us that the cracks appear in credit conditions first, not in equity prices. The 1994 Bond Massacre analog (58% similarity) and the 1997 Asian Crisis analog (56% similarity) are secondary — both suggest that rate surprises and emerging market stress can create buying opportunities if the domestic economy is strong.
The historical analog drawdown overlay is not available this week because the SPY drawdown from its recent high is not yet measurable — we are in a contested regime, not a confirmed drawdown. This is consistent with the 2005-2006 analog, where the market was grinding higher while risk was accumulating.
The Entry Question
The drawdown gauge is not applicable this week — we are not in a confirmed drawdown from a recent high. The S&P 500 ended the week lower on a rotation out of tech and AI plays, not a broad-based risk-off move. This is not a dip to buy. It is a rotation to navigate.
"The instinct to buy the dip is strongest when the dip is only half done — and this isn't even a dip yet. It's a rotation. Rotations don't become buying opportunities until the selling is indiscriminate."
Staged Entry Framework
| Stage | Trigger | Current | Distance | Action |
|---|---|---|---|---|
| Stage 1 | VIX > 35.0 for 3 consecutive days | 18.63 | 46.8% | Deploy 50% of dry powder into equities (quality/value tilt) |
| Stage 2 | HY OAS > 5.0% | 4.13% | 21.1% | Deploy remaining 50% into equities (broad market) |
Why these thresholds matter: The VIX at 35 signals genuine panic — the kind where retail and institutional investors are selling indiscriminately. The HY OAS at 5.0% signals credit stress that historically marks the bottom of selloffs. Together, they create a two-stage entry that avoids catching a falling knife while still deploying capital when fear is highest. The current distances (46.8% and 21.1%) tell you we are not close to either trigger.
The jobless claims threshold (236,500 weekly) is the early warning for the entry framework. Current claims at 215,000 are 9.1% below the threshold. If claims cross 236,500, we trim equity by 5% — not because we are panicking, but because the labor market is the single most reliable leading indicator for recession timing. A claims spike before a VIX spike means the recession is coming before the buying opportunity.
Sector Rotation & Strategy
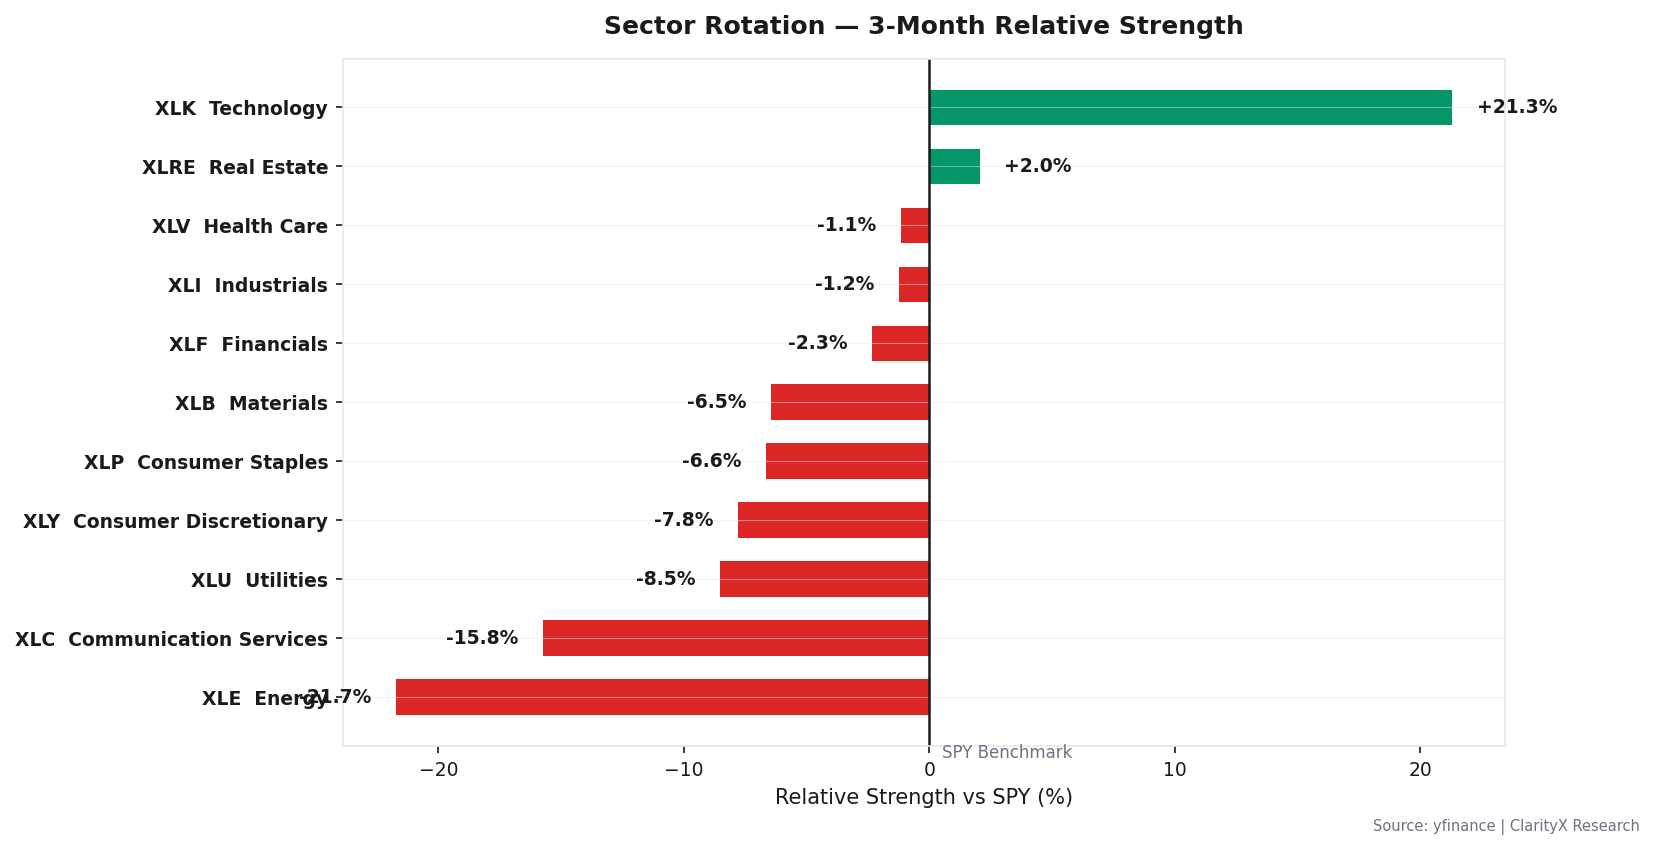
The rotation out of tech and AI plays is the dominant sector signal this week. The S&P 500 ended the week lower, but the selling was concentrated in the Mag6 names that have led the market for 18 months. This is not a broad-based risk-off move — it is a rotation within equities from high-multiple growth to value and quality. The 3-month relative strength of the value factor is improving, while the 3-month relative strength of the growth factor is deteriorating.
The validated strategy for this environment is mean reversion. The engine shows mean reversion has a regime fit for stagflation and late-cycle environments, with an 8.54% CAGR and 0.39 Sharpe ratio on the Mag6 universe (2020-2024 backtest). It works best in range-bound, late-cycle markets where momentum strategies fail. Trend following (23.70% CAGR, 1.16 Sharpe) is validated for Goldilocks and reflation regimes — neither of which is the current environment.
The options overlay from the engine is worth noting: a FEAR TRADE signal (BUY_PUT_SPREAD) on SPY at 0.8% of portfolio, with 90-day duration and 10% out-of-the-money strike. The engine's rationale: "Cheap tail protection costs less than 1% and pays off big in a crash. Think of it as fire insurance — you hope it expires worthless." With stagflation confidence at 44.8% and the liquidity crisis probability at 22.7%, this is rational insurance, not a directional bet.
The Portfolio
| Asset Class | Current Regime (Stagflation) | Target Regime (Late Cycle) | Recommended Now |
|---|---|---|---|
| Equity | 60% | 75% | 59% |
| Bonds | 6% | 6% | 3% |
| REITs | 2% | 3% | 1% |
| Commodities | 8% | 2% | 6% |
| Gold | 10% | 4% | 11% |
| TIPS | 6% | 2% | 6% |
| Intl Bonds | 2% | 2% | 2% |
| Cash | 6% | 6% | 12% |
| Total | 100% | 100% | 100% |
Defensive shift applied: 3%. The trip wire signal (1 warning, 0 critical) triggers a de-risk expressed within equity (rotate to value/quality/low-vol) rather than reducing equity exposure. Equity holds at the strategic anchor — the engine's SAA-holds-in-crisis framework means we do not sell equities in stagflation because earnings can still grow with prices. The de-risk is funded from bonds (6% → 3%) and REITs (2% → 1%), with the proceeds going to cash (6% → 12%).
The contradiction to address: Equity at 59% with a cautious macro outlook seems aggressive. The bridge is that the stagflation regime does not call for selling equities — it calls for rotating within them. The 59% equity allocation is a 1% reduction from the 60% strategic anchor, reflecting the warning trip wire. The real protection comes from the 12% cash (up from 6%) and the 17% real-asset ballast (commodities + gold + TIPS). This is not a "risk-on" portfolio. It is a "stay invested but hedged" portfolio.
The Watch List
| # | Trigger | Current | Threshold | Action if Triggered |
|---|---|---|---|---|
| 1 | VIX > 35.0 for 3 consecutive days | 18.63 | 35.0 | Execute Stage 1 entry (deploy 50% of dry powder) |
| 2 | HY OAS > 5.0% | 4.13% | 5.0% | Execute Stage 2 entry (deploy remaining 50%) |
| 3 | Initial jobless claims (weekly) > 236,500 | 215,000 | 236,500 | Trim equity 5% |
| 4 | NFCI > -0.429 | -0.505 | -0.429 | Tighten financial conditions flag |
| 5 | MARY confirms regime shift to HARD_LANDING or LIQUIDITY_CRISIS | — | — | Full crisis allocation |
Options overlay footnote: The FEAR TRADE signal (0.8% of portfolio, SPY put spread, 90-day duration) is active but not urgent. It is cheap insurance in a contested regime — expected to expire worthless 80% of the time, but pays off 10-25x if triggered. No action required this week.
Get this research delivered
New analysis, directly to your inbox. Research notifications only.