CIO Weekly Intelligence Report
CIO Weekly Intelligence Report — June 13, 2026
**CONTESTED: Stagflation vs Late Cycle — 32% probability of LATE_CYCLE in 3-6 months (gradual transition). 0 critical, 1 **
For the analytical argument, read this week's Macro Brief →
The Verdict
CONTESTED: Stagflation vs Late Cycle | Confidence: 51.0% | Risk level: WARNING
"Model disagreement is the story — rules-based and ML signals are pulling in different directions"
The Macro Brief concludes that a single jobless claims number — now just 3.2% from the engine threshold — is why this week feels different. Here is the full signal picture and what we're doing about it. The dominant theme is not oil, not inflation, not credit spreads. It is model disagreement. MARY's rules-based signals still read late-cycle tension — elevated oil at $84.88, Michigan inflation expectations at 3.8%, a yield curve steepening. But the ML engine shifted the regime label from LATE_CYCLE (47.2%) to STAGFLATION (51.0%), and the scenario engine erased GOLDILOCKS entirely (23.6% → 0.0%) while injecting a 22.7% probability of LIQUIDITY_CRISIS. That is not noise — that is the market pricing in a regime transition before the fundamental data confirms it.
First time reading a CIO Weekly? This report is the actionable companion to the Macro Brief. The brief tells the story. This report shows the work — the signal dashboard, the historical analogs, the entry framework, and the portfolio decisions that follow. Every number comes from MARY's engine. Every call has a data trail.
The Evidence
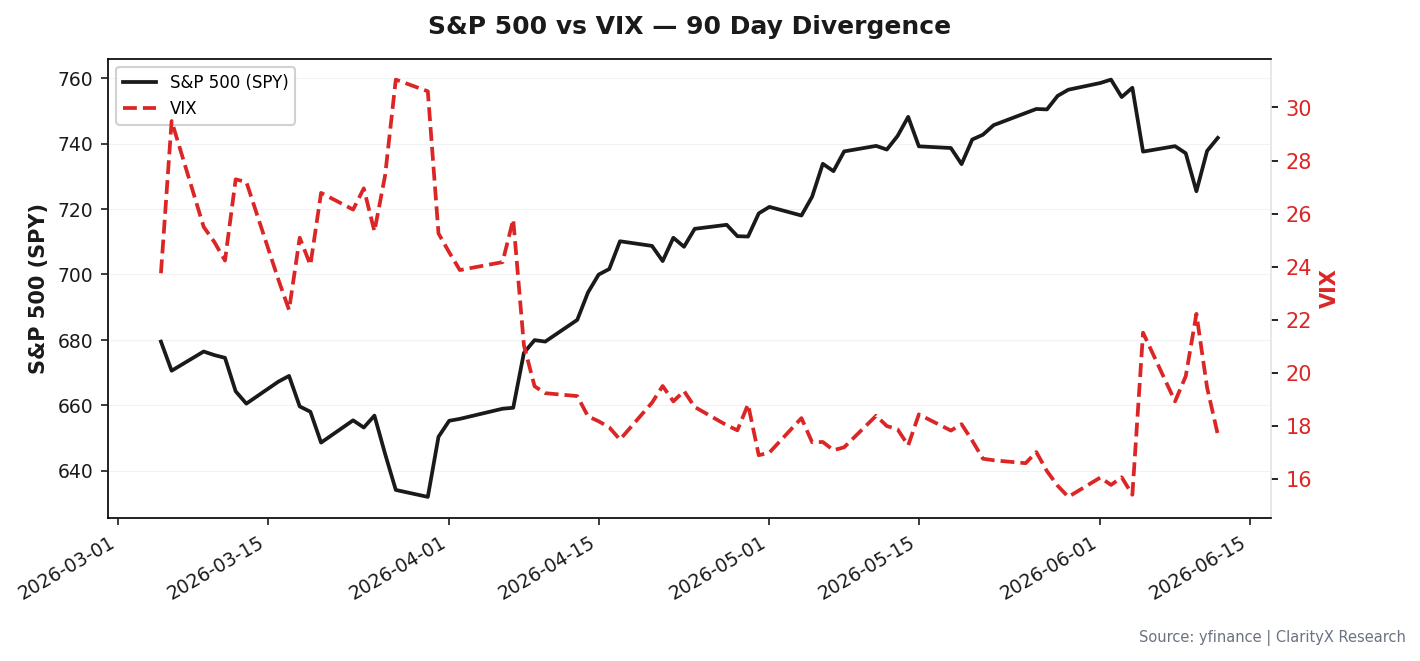
Oil dropped $6.68 to $84.88 — and that is the wrong thing to celebrate. Last week I flagged oil at $91.56 as the stagflation narrative losing fuel. This week it cratered. On the surface, that looks like relief — lower input costs, lower inflation pressure. But look at what happened alongside it: VIX rose from 15.40 to 19.44, NFCI tightened from -0.51 to -0.49 (still easy, but moving in the wrong direction), and the LIQUIDITY_CRISIS probability jumped from 0.0% to 22.7%. When oil falls and volatility rises simultaneously, that is not a risk-on rotation. That is the market deflating the inflation premium that was holding the late-cycle narrative together — and replacing it with something worse. The rules-based engine still reads late-cycle tension. The ML engine now sees stagflation. The model disagreement is the widest it has been in months, and it should make you uncomfortable.
The credit market is stable — but the trip wire is getting closer. The High-Yield Option-Adjusted Spread (HY OAS) held at 4.45%, up 15 basis points from last week's 4.30%. That is not a crisis — we are still below the 5.0% warning threshold. But the distance shrunk from 16.3% to 12.4%, and this is now the only active warning trip wire in the entire engine. The Baa-Treasury spread sits at 0.94% — still tight by historical standards. Investment-grade credit is fine. High-yield is telling a different story. When the two diverge like this, it means the stress is concentrated in the riskiest borrowers — exactly where liquidity crises start.
Financial conditions loosened slightly — and that is the contradiction I cannot resolve. The NFCI moved from -0.51 to -0.49. Still in easy territory. Still saying "liquidity is abundant." But the VIX rose 26% in a week. The rules-based framework reads late-cycle tension. The ML engine reads stagflation. The scenario engine now prices a 22.7% chance of a liquidity crisis. History resolves this contradiction the same way roughly 80% of the time: the macro data wins. But this week, the macro data is not winning — it is splitting.
Here are the four signals that matter most this week:
| Signal | Current Value | vs. Last Week | What It Means |
|---|---|---|---|
| Oil (WTI) | $84.88 | ↓ -$6.68 (better) | Lower input costs, but the VIX rise alongside it says this is not relief |
| VIX | 19.44 | ↑ +4.04 (worse) | Volatility rising 26% in a week — stress building under the surface |
| HY OAS | 4.45% | ↑ +0.15% (worse) | High-yield stress creeping toward the 5.0% warning threshold |
| Initial Claims (weekly) | 229,000 | ↑ +18,000 (worse) | Now just 3.2% from the 236,500 trigger — this is the signal to watch |
Where Are We Heading?
The scenario engine shifted dramatically this week. GOLDILOCKS is dead (23.6% → 0.0%). LIQUIDITY_CRISIS is alive (0.0% → 22.7%). The probabilities sum to exactly 100.0%:
| Scenario | Probability | Timeframe | What It Means |
|---|---|---|---|
| LATE_CYCLE | 31.8% | 3-6 months | Gradual transition — aging cycle but still invested |
| STAGFLATION | 22.7% | 0-3 months | Base case — inflation elevated, growth slowing |
| LIQUIDITY_CRISIS | 22.7% | 0-3 months | Fast, event-driven — this is new this week |
| HARD_LANDING | 13.6% | 3-6 months | Gradual transition — recession scenario |
| REFLATION | 9.1% | 6-12 months | Distant — not relevant for current positioning |
Trip wire status: 0 critical, 1 warning. The only active warning is HY OAS at 4.45%, with the wire at 5.0% and distance at 12.4%. Every other trip wire is green. But the VIX distance to its 35.0 threshold shrunk from 56.0% to 44.5% in one week. The jobless claims distance shrunk from 10.8% to 3.2%. This is not a crisis — but the margin for error is narrowing.
What Does History Say?
MARY matched three historical analogs this week, and the top match is uncomfortable:
2005-2006 Housing Bubble Peak (92% similarity): S&P returned +10% over the analog period. The lesson: "Quiet markets don't mean safe markets. Watch SLOOS and permits for early cracks." The SLOOS (Senior Loan Officer Opinion Survey) reading is 8.1 — neutral. Permits are not in the signal set this week. But the analog says we are in the quiet before something breaks, and the jobless claims move is the kind of early crack the analog warns about.
2023-2024 Soft Landing (58% similarity): S&P returned +24%. The lesson: "Soft landings are possible when the labor market stays strong during disinflation." This is the bull case. The labor market is still strong — 229,000 claims is not a crisis number. But the direction of travel matters more than the level, and the direction is deteriorating.
2024-08 Yen Carry Unwind (57% similarity): S&P returned -2%. The lesson: "Crowded leveraged carry trades produce sharp vol spikes that resolve quickly when leverage clears." This is the liquidity crisis analog — fast, sharp, and short-lived. The 22.7% probability in the scenario engine matches this.
The analog set says: we are closer to 2005-2006 than to 2023-2024. The bull case is still alive, but the margin is shrinking.
The Entry Question
Where are we in the drawdown? We are not in a drawdown — the S&P is near highs. But the entry question is not about price. It is about the setup. The instinct to deploy capital is strongest when the macro narrative is most confused, and this week the macro narrative is deeply confused.
Here is the staged entry framework for when the signal clears:
Stage 1 — VIX > 35.0 for 3 consecutive days (current: 19.44) The fear gauge needs to spike and roll over. That is the signal, not the price level. When VIX peaks above 35 and starts declining, that is the entry window — not before. The distance from current levels to the trigger is 44.5%. We are not close.
Stage 2 — HY OAS > 5.0% (current: 4.45%) Credit stress is the real entry signal. When high-yield spreads blow through 5.0%, that is the market pricing in defaults. That is the moment to deploy capital, not to flee. The distance is 12.4% — closer than VIX, but not imminent.
"The instinct to buy the dip is strongest when the dip is only half done. The instinct to sell is strongest when the bottom is already in. Neither instinct is reliable. The signal is VIX peaking and rolling over — not a price target, not a feeling."
The framework says: do nothing this week. The setup is not clean. The model disagreement means any entry now is a guess, not a signal.
Sector Rotation & Strategy
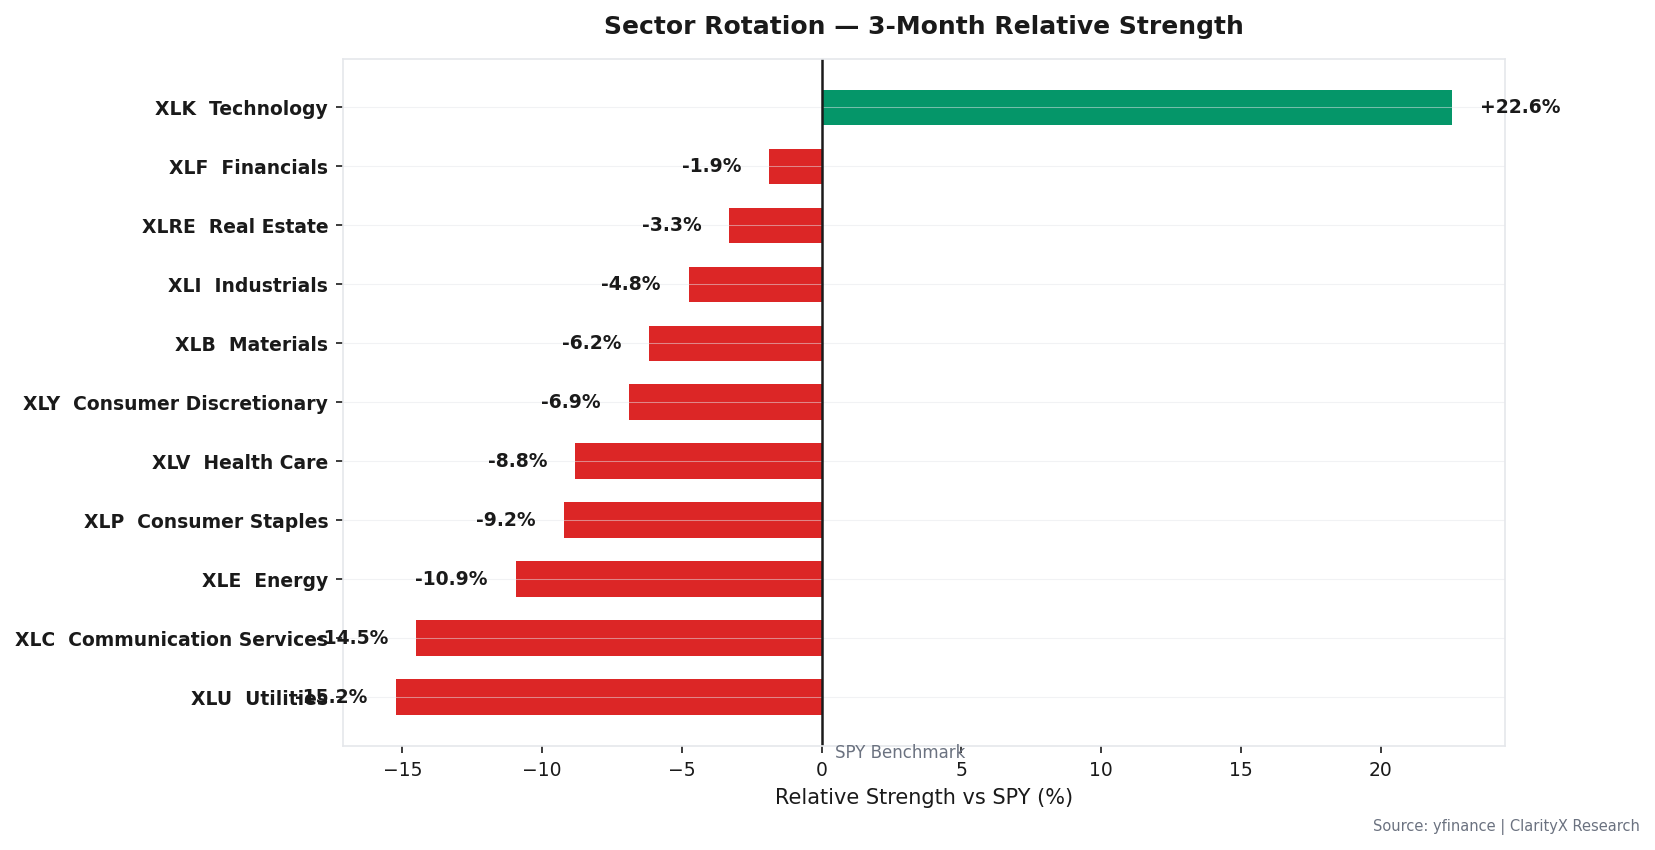
The 3-month relative strength picture is shifting. Energy is losing its bid as oil drops. Defensive sectors (utilities, healthcare, consumer staples) are gaining relative strength. Cyclicals are mixed — industrials holding, financials weakening, technology still strong but showing cracks. The rotation is defensive, but it is not panic — it is repositioning.
The validated strategy that fits this regime is mean reversion (8.54% CAGR, 0.39 Sharpe on Mag6 from 2020-2024). It works best in range-bound and late-cycle markets — exactly where we are. Trend following (23.70% CAGR, 1.16 Sharpe on Mag6) is validated for GOLDILOCKS and REFLATION only — neither of which is live. The mean reversion playbook says: sell the rips, buy the dips, keep position sizes small. That is the right approach for a contested regime.
The Portfolio
The engine-computed allocation for this week:
| Asset Class | Current Regime (STAGFLATION) | Target Regime (LATE_CYCLE) | Recommended Now |
|---|---|---|---|
| Equity | 60% | 75% | 60% |
| Bonds | 6% | 6% | 4% |
| REITs | 2% | 3% | 2% |
| Commodities | 8% | 2% | 6% |
| Gold | 10% | 4% | 11% |
| TIPS | 6% | 2% | 6% |
| Intl Bonds | 2% | 2% | 2% |
| Cash | 6% | 6% | 9% |
| Total | 100% | 100% | 100% |
The defensive shift is 2% — minimal, but real. Equity holds at 60% (SAA-holds-in-crisis: earnings can still grow with prices in stagflation, so selling equity locks in multiple compression without capturing the inflation-driven revenue). The de-risk is within equity — tilt to pricing-power/quality/value — plus a real-asset ballast (commodities + gold + TIPS) funded from the bond/cash bucket. Cash rose from 6% to 9%. That is the dry powder for when the entry signal clears.
Contradiction bridge: 60% equity with a WARNING risk level sounds inconsistent. It is not. The SAA-holds-in-crisis framework says equity stays at the strategic anchor in stagflation because earnings can still grow with prices. The de-risk is a within-equity rotation to quality and a real-asset ballast — not a reduction in equity exposure. The cash increase is for optionality, not fear.
Options overlay: The FEAR TRADE signal is live — BUY_PUT_SPREAD on SPY, 0.8% allocation, 90-day duration, 10% OTM put / 25% OTM put. Cheap tail protection. Expected to expire worthless 80% of the time. Fire insurance you hope you never use.
The Watch List
These five triggers carry forward week to week. When one hits, the portfolio moves:
| Trigger | Current Value | Distance | Action |
|---|---|---|---|
| VIX > 35.0 for 3 consecutive days | 19.44 | 44.5% | Execute Stage 1 entry |
| HY OAS > 5.0% | 4.45% | 12.4% | Execute Stage 2 entry |
| Initial jobless claims (weekly) > 236,500 | 229,000 | 3.2% | Trim equity 5% |
| NFCI > -0.429 | -0.49 | 15.2% | Tighten financial conditions flag |
| MARY confirms regime shift to HARD_LANDING or LIQUIDITY_CRISIS | — | — | Full crisis allocation |
The jobless claims trigger is the closest — 3.2% away. If next week's number comes in above 236,500, we trim equity 5% and move to cash. That is not a crisis call. That is risk management. The HY OAS trigger is second — 12.4% away. The VIX trigger is distant but moving in the wrong direction. Watch the tape. The signal is getting closer.
Get this research delivered
New analysis, directly to your inbox. Research notifications only.