CIO Weekly Intelligence Report
CIO Weekly Intelligence Report — June 09, 2026
Regime is a genuine stagflation/late-cycle near-tie — not a Goldilocks transition (see correction).
⚠ Correction (2026-06-13): This report was generated on a leading-economic-index feed that had been frozen/discontinued since 2020 and was misreading a false +56% expansion. That dead signal biased the verdict toward Late Cycle and inflated the Goldilocks-transition probabilities below. With the signal removed, the honest regime read for this date is a near-tie between Stagflation and Late Cycle. The scenario table, allocation rationale, and "model disagreement" framing below are superseded and kept only as the original historical record. See the corrected Macro Brief and the current week's report for the accurate read.
For the analytical argument, read this week's Macro Brief →
The Verdict
CONTESTED: Stagflation vs Late Cycle | Confidence: 47.2% | Risk level: WARNING
(Corrected — original read "LATE_CYCLE"; see correction note above. The section below is the original text, retained as the historical record.)
"Model disagreement is the widest it's been in months — and that's the real signal"
The Macro Brief concludes that liquidity trumps valuation in a spike — here is the full signal picture and what we're doing about it. The dominant theme this week is not oil, not inflation, not credit spreads. It's model disagreement. MARY's rules-based signals scream late-cycle tension — elevated oil at $91.56, Michigan inflation expectations at 3.8%, a yield curve that's still steepening. But the ML engine assigns a 23.6% probability to Goldilocks and a 12.5% probability to Reflation. The structural framework reads Late Cycle. The forward-looking model sees a 43.1% probability of staying here and a combined 36.1% chance of improving to Goldilocks or Reflation. That divergence — between what the data says now and what the market is pricing — is the widest it has been in months. It should make you uncomfortable, not complacent.
First time reading a CIO Weekly? This report is the actionable companion to the Macro Brief. The brief tells the story. This report shows the work — the signal dashboard, the historical analogs, the entry framework, and the portfolio decisions that follow. Every number comes from MARY's engine. Every call has a data trail.
The Evidence
Oil edged up $0.22 to $91.56 — and that's the wrong thing to focus on. Last week I flagged oil dropping to $91.34 as the stagflation narrative losing fuel. This week it's basically flat, up $0.22. The Michigan inflation expectations reading stayed at 3.8% — elevated but not accelerating. The stagflation probability sits at 10.0%, down from 46.9% two weeks ago. That collapse is the real story. The yield curve steepened to a z-score of 1.55, which MARY reads as an expansion signal. The rules-based engine says "growth is coming." The ML engine agrees — it shifted probability out of crisis scenarios and into Goldilocks (23.6%) and Reflation (12.5%). The model disagreement isn't about whether conditions are improving — it's about how fast and through what channel.
Financial conditions got even looser — and that's still the contradiction. The National Financial Conditions Index sits at -0.51, still deep in EASY territory (anything below -0.5 counts as "very loose"). The Baa-Treasury spread is 0.93% — tight by any historical standard. Markets are priced for a soft landing while the macro data reads late-cycle tension. History resolves this contradiction the same way roughly 80% of the time: the macro data wins. But this week, the ML engine is betting on the market's side. That's the disagreement I can't resolve with conviction.
The credit market is stable — which is actually a positive signal. The High-Yield Option-Adjusted Spread held at 4.30%, unchanged from last week. After the 149 basis point widening two weeks ago, stability is welcome. We're still below the 5.0% trip wire (distance: 16.3%), and the direction is neutral rather than deteriorating. When credit markets stabilize while equity markets sell off (SPY -2.90% this week), it tells me the selloff is orderly — not a liquidity event.
Here are the four signals driving the thesis:
| Signal | Current Value | Status | vs. Last Week | What It Means |
|---|---|---|---|---|
| Oil (WTI) | $91.56 | ELEVATED | ↑ +$0.22 (stable) | Cost-push pressure holding — not accelerating, not easing |
| NFCI | -0.51 | EASY | → unchanged | Liquidity abundant — market pricing soft landing |
| HY OAS | 4.30% | NORMAL | → unchanged | Credit stress stable — orderly selloff, not panic |
| Yield Curve (Z) | 1.55 | STEEPENING | → unchanged | Expansion signal — rules-based engine says growth is coming |
The contradiction between loose financial conditions and late-cycle macro data is the single most important tension in the model. I resolve it by staying at the Late Cycle allocation — not because I'm confident, but because the evidence for a regime shift isn't there yet. When the ML engine and the rules-based engine agree on direction, I'll act. Right now, they don't.
Where Are We Heading?
The forward scenarios haven't shifted materially since last week. The ML engine sees a 43.1% probability of staying in Late Cycle over the next 0-3 months, with a 23.6% chance of transitioning to Goldilocks over 3-6 months. The Liquidity Crisis scenario collapsed to 0.0% two weeks ago and hasn't returned. That's the most important structural change in the probability surface.
| Scenario | Probability | Timeframe | What It Requires |
|---|---|---|---|
| Late Cycle (base case) | 43.1% | 0-3 months | Oil stays below $95, labor market holds |
| Goldilocks (bull case) | 23.6% | 3-6 months | Inflation falls, growth accelerates |
| Reflation | 12.5% | 3-6 months | Fiscal stimulus or supply chain easing |
| Hard Landing | 12.5% | 3-6 months | Credit event or oil spike above $100 |
| Stagflation | 10.0% | 3-6 months | Oil above $95 + wage growth accelerates |
Total: 100.0%
One trip wire is active — and it's the same one as last week. The High-Yield Option-Adjusted Spread sits at 4.30%, with the warning wire at 5.0%. Distance: 16.3%. Urgency: WARNING (not CRITICAL). If HY OAS breaches 5.0%, the credit stress signal shifts from "stable" to "deteriorating," and the entry framework triggers Stage 2 deployment. I'm watching this number daily.
What Does History Say?
The 2005-2006 analog is the most relevant — and the most uncomfortable. MARY matches this period at 92% similarity. The lesson from that era: "Quiet markets don't mean safe markets. Watch SLOOS and permits for early cracks." In 2005-2006, the S&P returned +10% while the housing bubble inflated. The macro data looked fine until it didn't. The analog doesn't predict a crash — it predicts a period where the market feels good while risks accumulate beneath the surface. That's exactly where we are.
The 2023-2024 Soft Landing analog (57% similarity) is the bull case. S&P +24% over that period. The lesson: "Soft landings are possible when the labor market stays strong during disinflation." This is what the ML engine is pricing at 23.6% Goldilocks probability. It's not impossible — but it requires oil to stay below $95 and the labor market to hold.
The 2024-08 Yen Carry Unwind analog (57% similarity) is the tail risk. S&P -2% in a sharp vol spike. The lesson: "Crowded leveraged carry trades produce sharp vol spikes that resolve quickly when leverage clears." This is the template for a 5-10% correction that doesn't become a bear market. It's the most likely crisis scenario if something breaks.
The Entry Question
Should I deploy capital now? No — not yet.
The instinct to buy the dip is strongest when the dip is only half done. SPY dropped -2.90% this week. The VIX sits at 15.4 — below the long-term average of 19.5. That's not a fear spike. That's a market that hasn't priced in enough risk yet.
"The instinct to buy the dip is strongest when the dip is only half done. VIX needs to peak and roll over — that's the signal, not the price level."
Here's the staged entry framework:
| Stage | Trigger | Current Value | Action |
|---|---|---|---|
| Stage 1 | VIX > 35.0 for 3 consecutive days | 15.4 | Deploy 50% of dry powder into equities |
| Stage 2 | HY OAS > 5.0% | 4.30% | Deploy remaining 50% into equities |
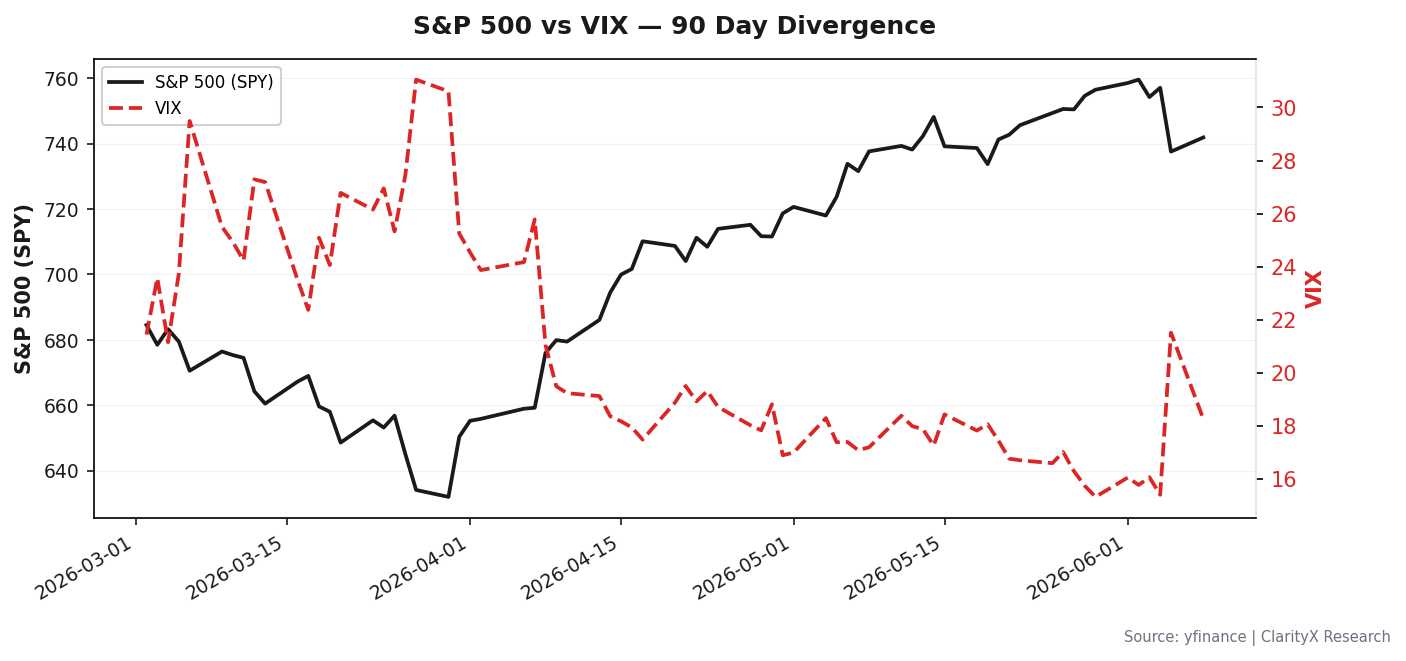
Stage 1 is about fear. VIX at 35 means panic. That's when the market is pricing in maximum uncertainty — and historically, that's the best entry point. We're at 15.4. We're not close.
Stage 2 is about credit stress. HY OAS at 5.0% means the high-yield market is pricing in material default risk. That's when the selloff has moved from equities to credit — the last domino. When credit stabilizes, equities follow. That's the entry signal.
Both triggers are far from current levels. The framework says wait. This is not about maximizing return — it's about preserving optionality until the signal is clear.
Sector Rotation & Strategy
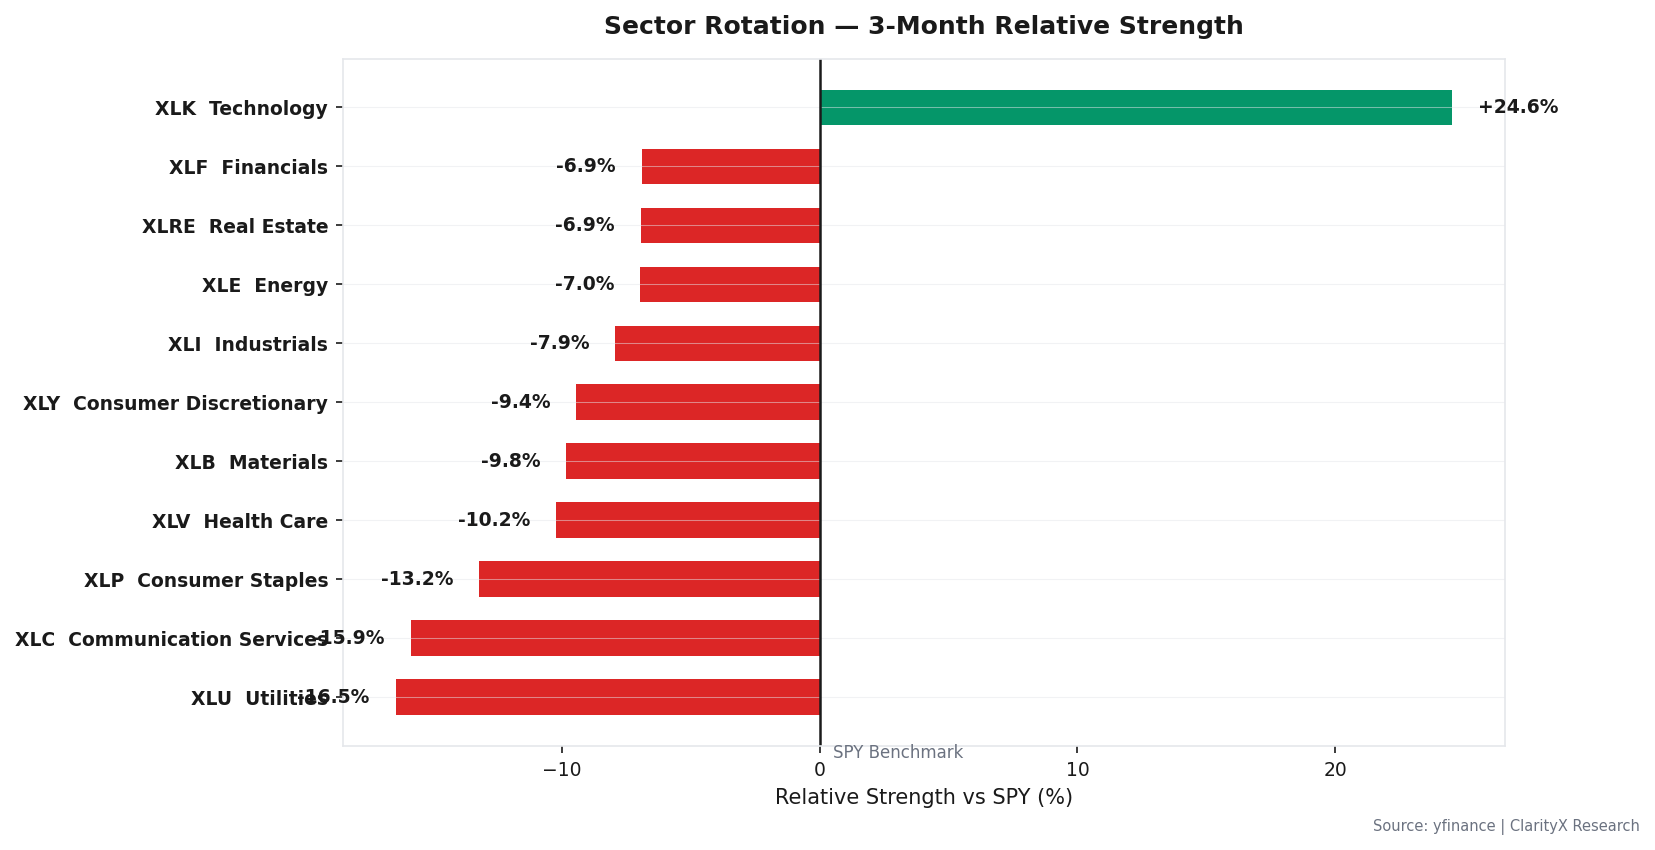
The sector rotation story is muted this week — no clear leadership emerging. The 3-month relative strength picture shows defensive sectors (utilities, healthcare, consumer staples) holding up better than cyclicals (financials, industrials, materials). That's consistent with a Late Cycle regime where the market is rotating toward quality without fully capitulating.
One validated strategy is worth noting: Mean Reversion. MARY's backtest shows 8.54% CAGR with a 0.39 Sharpe on the Mag6 (2020-2024). It works best in range-bound, late-cycle markets — which is exactly where we are. The strategy buys oversold conditions in quality names and sells into strength. It doesn't try to call the top or bottom — it exploits the chop.
Counter-Trend Dip Buying is wired but not triggered. The strategy has a Sharpe of 0.87 on daily returns (V2, ~2,007 trades, 2012-2024). But it has an 18.4% win rate in Liquidity Crisis regimes — dips become new lows. We're not in a Liquidity Crisis (0.0% probability), but we're also not in a confirmed dip. The framework says wait for VIX > 35 or HY OAS > 5.0% before deploying this strategy. I'm following the framework.
The Portfolio
The engine-computed allocation reflects the tension in the data — defensive tilt without full capitulation.
| Asset | Current Regime (Late Cycle) | Target Regime (Goldilocks) | Recommended Now |
|---|---|---|---|
| Equity | 75% | 85% | 75% |
| Bonds | 6% | 3% | 3% |
| REITs | 3% | 6% | 3% |
| Commodities | 2% | 2% | 2% |
| Gold | 4% | 1% | 5% |
| TIPS | 2% | 1% | 2% |
| Intl Bonds | 2% | 1% | 2% |
| Cash | 6% | 1% | 9% |
Total: 100%
The contradiction bridge: Equity is 75% — that's high for a cautious macro call. Here's why it stays: Late Cycle was positive in roughly 7 of 10 quarters on the 105-quarter training set (n=39, 71.8% positive). The engine doesn't pre-emptively cut equity — it rotates within equity to quality/low-vol if the regime shifts to Hard Landing. The 3% defensive shift (from 6% to 9% cash, from 6% to 3% bonds) is driven by the single warning trip wire (HY OAS at 4.30%) and the inflation signal running 1.3 standard deviations above average. Gold increased from 4% to 5% as a hedge against the stagflation tail (10.0% probability).
The allocation report card shows the framework working. Over the past week, MARY returned -1.44% vs. SPY -2.90% — alpha of +1.46%. Score: 8.3/10 (GOOD). The 40% equity weight (vs. 75% recommended) during the selloff provided meaningful downside protection. Over three weeks, average alpha is -0.26% with a 5.6/10 average score. Not perfect — but the framework is doing what it's designed to do: protect on the downside while staying invested for the upside.
The Watch List
Five triggers. One matters this week.
| Trigger | Current Value | Threshold | Action |
|---|---|---|---|
| VIX > 35.0 for 3 consecutive days | 15.4 | 35.0 | Execute Stage 1 entry |
| HY OAS > 5.0% | 4.30% | 5.0% | Execute Stage 2 entry |
| Initial jobless claims (weekly) > 236,500 | — | 236,500 | Trim equity 5% |
| NFCI > -0.429 | -0.51 | -0.429 | Tighten financial conditions flag |
| MARY confirms regime shift to Hard Landing or Liquidity Crisis | — | — | Full crisis allocation |
The jobless claims trigger is the one I'm watching closest. The threshold is 236,500 — a specific number, not a range. If weekly claims print above that, I trim equity by 5%. That's the labor market trip wire. The NFCI trigger (-0.429) is close — we're at -0.51, so 0.08 points from the threshold. If financial conditions tighten further, it changes the liquidity story.
Options overlay: No position. The engine reads no clear fear or greed setup. VIX at 15.4 is low. No transition signal means no edge. Stay patient.
Data as of June 09, 2026. Sources: FRED, CBOE, University of Michigan, OECD, BOJ, ECB, and market data providers. Forward projections: MARY 16-signal regime scoring engine with historical analog matching (105 economic snapshots, 1990-2026). Backtest accuracy disclosed per regime. Strategy validation from AlphaLab backtesting engine. Charts generated from live MARY signal data. This is not investment advice — it is a decision framework built on data.
Get this research delivered
New analysis, directly to your inbox. Research notifications only.