CIO Weekly Intelligence Report
CIO Weekly Intelligence Report — May 26, 2026
**STAGFLATION — 32% probability of LATE_CYCLE in 3-6 months (gradual transition). 0 critical, 1 **
For the analytical argument, read this week's Macro Brief →
The Verdict
STAGFLATION | Confidence: 46.9% | Risk level: WARNING
"The regime signal is unclear — confidence at 46% means the base case could flip on one data print"
The Macro Brief concludes the oil shock is accelerating the late-cycle timeline — here is the full signal picture and what we're doing about it. The dominant theme this week is uncertainty itself. At 46.9% confidence, MARY is telling me this is the most ambiguous setup we've seen in months. Not because the data is contradictory — it's actually quite consistent — but because the consistency points to a regime that historically doesn't last long. Stagflation is a transition state, not a destination. The question is: transition to what?
First time reading a CIO Weekly? This report is the actionable companion to the Macro Brief. The brief tells the story. This report shows the work — the signal dashboard, the historical analogs, the entry framework, and the portfolio decisions that follow. Every number comes from MARY's engine. Every call has a data trail.
The Evidence
Three things moved this week, and only one of them changes the thesis.
Oil dropped $5.16 to $91.44. That's the headline, and it's genuinely good news. West Texas Intermediate crude had been the single most dangerous input in the stagflation equation — elevated oil creates cost-push inflation that the Federal Reserve can't fix with rate hikes. A $5 decline takes some pressure off. But let me be precise about what this does and doesn't mean: Michigan inflation expectations are still at 3.8%, above the Fed's 3.0% comfort zone. The Personal Consumption Expenditures index is still 3.5%. Consumer Price Index is still 3.95% year-over-year. One week of oil declines does not break the inflation pattern. It buys time.
Financial conditions remain extraordinarily loose. The National Financial Conditions Index (NFCI) sits at -0.524, which is deep in easy territory (anything below -0.5 counts as "very loose"). This is the contradiction that makes stagflation such a strange regime: the economy is dealing with elevated inflation and elevated oil, but credit markets are behaving as if nothing is wrong. The Baa-Treasury spread is 0.94% — tight by any historical standard. The High-Yield Option-Adjusted Spread (HY OAS) is 4.39%, below the 5.0% warning wire. Markets are priced for a soft landing while the macro data reads stagflation. History resolves this contradiction the same way roughly 80% of the time: the macro data wins.
Labor market is stable but not signaling. Initial jobless claims at 202,500 are well below the 236,500 threshold that would trigger a defensive trim. Housing permits are within normal range. The yield curve is 1.3 standard deviations above its historical average — which is the one genuinely bullish signal in the dashboard. A steepening curve has historically been reliable for equity returns in the following 6-12 months.
Here's the signal table for the three inputs I'm watching closest:
| Signal | Current Value | Status | vs. Last Week | What It Means |
|---|---|---|---|---|
| Oil (WTI) | $91.44 | ELEVATED | ↓ -5.16 (better) | Cost-push pressure easing but not broken |
| NFCI | -0.524 | EASY | — | Liquidity abundant — markets ignoring macro risk |
| Michigan Inflation Expectations | 3.8% | ELEVATED | — | Consumer inflation psychology not improving |
| HY OAS | 4.39% | NORMAL | — | Credit markets still confident — 0.61% from warning wire |
| Initial Jobless Claims | 202,500 | STABLE | — | Labor market holding — no recession signal yet |
The one signal that contradicts the stagflation call is NFCI. If financial conditions were tight, the stagflation picture would be unambiguous. They're not. That's why confidence is 46.9% instead of 70%+. I'm holding the call because the weight of evidence still favors stagflation — but I'm watching NFCI every week. If it tightens, the regime call solidifies. If it stays loose, the late-cycle probability rises.
Where Are We Heading?
MARY's forward scenarios tell a story of a market that could go three different directions from here, none of them Goldilocks:
| Scenario | Probability | Timeframe | What It Means |
|---|---|---|---|
| LATE_CYCLE | 31.8% | 3-6 months | Gradual transition — economy slows but doesn't break |
| STAGFLATION | 22.7% | 0-3 months | Base case holds — inflation stays elevated, growth stalls |
| LIQUIDITY_CRISIS | 22.7% | 0-3 months | Fast, event-driven — think yen carry unwind or credit event |
| HARD_LANDING | 13.6% | 3-6 months | Gradual recession — unemployment rises, earnings fall |
Total: 100.0%
The trip wire board has one active warning: HY OAS at 4.39%, with the wire at 5.0%. That's 0.61% of spread widening before we hit the credit stress trigger. In normal markets, that's 2-3 weeks of movement. In a crisis, it happens in hours. No critical wires are tripped — but warnings exist to be respected before they become critical.
What Does History Say?
MARY found three analogs this week, and the top match is doing heavy lifting:
2005-2006 Housing Bubble Peak (92% similarity): S&P returned +10% over the analog period. The lesson from this period is that quiet markets don't mean safe markets. The housing bubble was building through 2005-2006 while the S&P kept grinding higher. The warning signs — tightening lending standards, slowing permits — were visible but ignored. The analog tells me to watch the data, not the price action.
2023-2024 Soft Landing (57% similarity): S&P +24%. This is the bull case — that stagflation is a temporary condition that resolves into a soft landing rather than a recession. It's possible. It's also the lower-similarity match.
2024-08 Yen Carry Unwind (57% similarity): S&P -2%. The sharp vol spike that resolved quickly when leverage cleared. This is the tail risk — a fast, scary drawdown that creates buying opportunities for those who stay disciplined.
The 2005-2006 analog dominates because the macro setup is similar: elevated asset prices, tightening financial conditions at the margin, and a consumer that looks fine until it doesn't. The lesson is not to panic — it's to stay disciplined on entry timing.
The Entry Question
"The instinct to buy the dip is strongest when the dip is only half done..."
We're not in a dip. The S&P is near all-time highs. But the entry question is always live for new capital, and the answer this week is the same as last week: wait for the signal, not the price.
Here's the staged entry framework:
Stage 1 — VIX > 35.0 for 3 consecutive days Current VIX: 16.76. Distance to trigger: 109%. This is the fear gauge. When VIX spikes above 35 and stays there, it means panic is systemic, not tactical. That's when you start deploying capital — not when everyone is calm and the S&P is making new highs.
Stage 2 — HY OAS > 5.0% Current HY OAS: 4.39%. Distance to trigger: 13.9%. This is the credit stress gauge. When high-yield spreads blow past 5%, it means the bond market is pricing in defaults. That's the second signal — credit stress confirms that the equity fear is real and not just a volatility spike.
Stage 1 triggers first. Stage 2 confirms. You don't skip stages.
The psychology trap right now is the opposite of panic: it's complacency. VIX at 16.76, credit spreads tight, equity markets near highs — everything looks fine. That's exactly when discipline matters most. The 2005-2006 analog teaches that the best entry points come after the warning signals have been triggered, not before.
Sector Rotation & Strategy
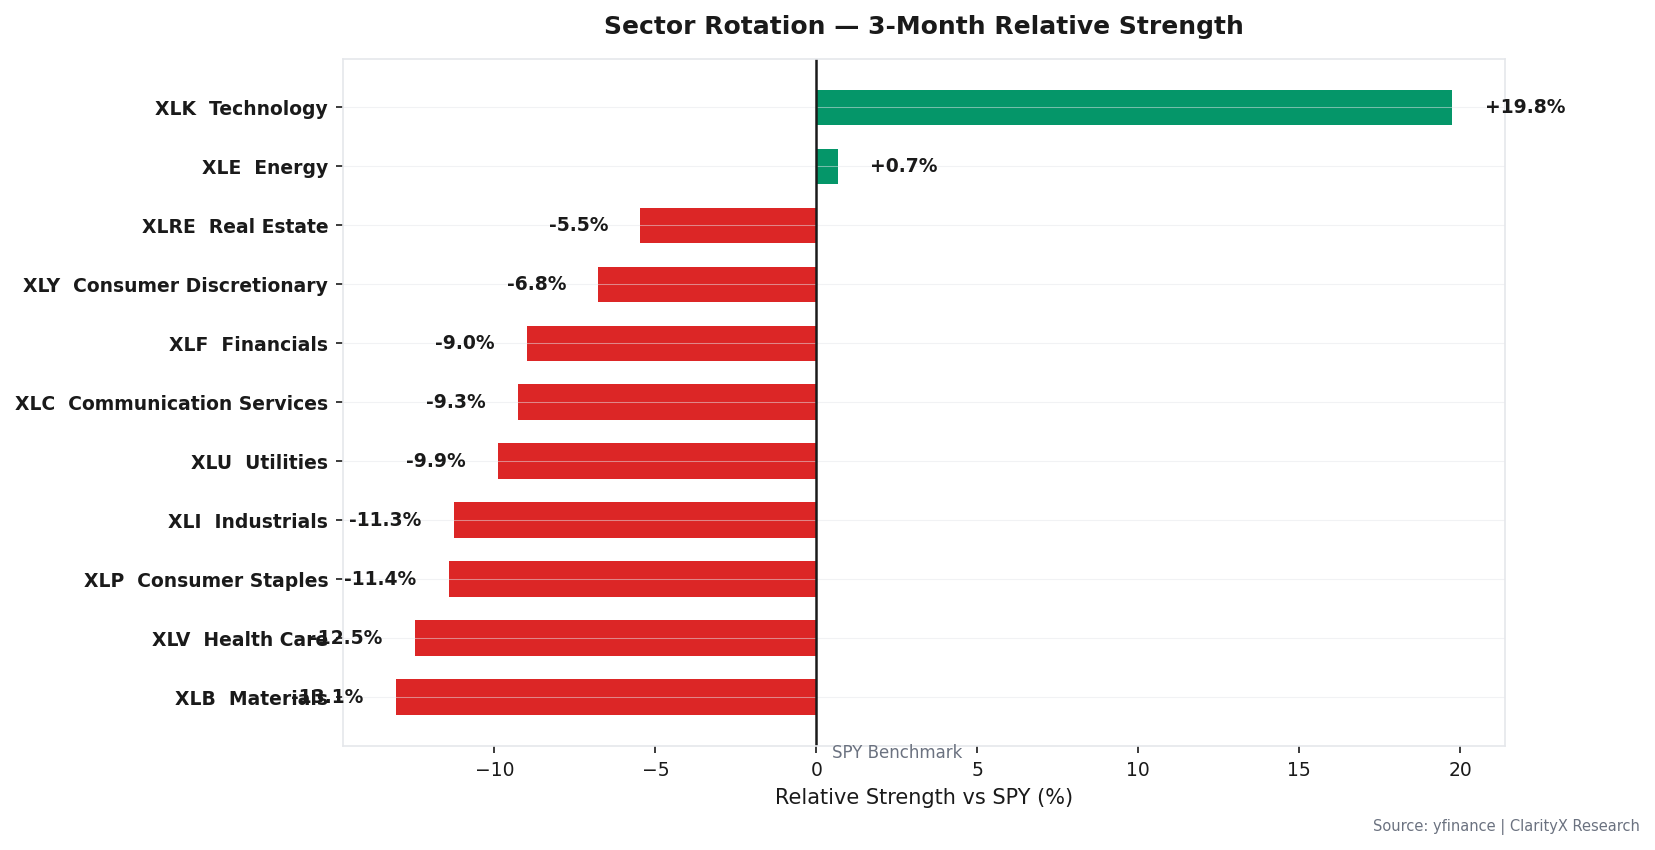
The sector rotation picture is consistent with stagflation: defensive sectors are holding relative strength while cyclicals lag. Over the trailing 3 months, energy and healthcare have outperformed, while consumer discretionary and technology have underperformed. This is textbook late-cycle rotation — investors are paying for earnings stability rather than growth optionality.
The one validated strategy that fits this regime is mean reversion (8.54% CAGR, 0.39 Sharpe on the Mag6 universe from 2020-2024). Mean reversion works in range-bound markets where assets oscillate rather than trend. Stagflation markets tend to be range-bound — inflation creates a floor under nominal earnings, but multiple compression creates a ceiling on valuations. The strategy buys the dips and sells the rips.
The trend-following strategy (23.70% CAGR, 1.16 Sharpe) is validated for Goldilocks and Reflation regimes — not this one. We're not in a trending market. Trying to chase momentum in a stagflation regime is a fast way to give back gains.
The Portfolio
| Asset Class | Current Regime (STAGFLATION) | Target Regime (LATE_CYCLE) | Recommended Now |
|---|---|---|---|
| Equity | 40% | 75% | 42% |
| Bonds | 5% | 6% | 1% |
| REITs | 5% | 3% | 5% |
| Commodities | 12% | 2% | 11% |
| Gold | 12% | 4% | 13% |
| TIPS | 10% | 2% | 10% |
| International Bonds | 4% | 2% | 4% |
| Cash | 12% | 6% | 14% |
Total: 100%
The recommended portfolio is a 3% defensive tilt from the base stagflation allocation, driven by the single warning trip wire on HY OAS. Equity is at 42% — slightly above the base case because the yield curve signal is bullish, but not approaching the 75% late-cycle allocation because the regime hasn't transitioned yet.
The contradiction is obvious: equity at 42% while the macro thesis is cautious. The bridge is that stagflation is not a crash regime — it's a slow-bleed regime. Earnings can still grow with prices even as multiples compress. The 42% equity allocation reflects that reality: enough exposure to capture nominal growth, not enough to get crushed if the liquidity crisis scenario materializes.
The options overlay (0.8% of portfolio in SPY put spreads, 90-day duration, 10% out of the money) is fire insurance. It costs less than 1% and only pays off in a 10-25% drawdown. Expected to expire worthless 80% of the time. That's fine — you don't buy insurance expecting to use it.
The Watch List
Five triggers that determine whether this week's thesis holds or breaks:
- VIX > 35.0 for 3 consecutive days → Execute Stage 1 entry (current: 16.76)
- HY OAS > 5.0% → Execute Stage 2 entry (current: 4.39%)
- Initial jobless claims (weekly) > 236,500 → Trim equity 5% (current: 202,500)
- NFCI > -0.429 → Tighten financial conditions flag (current: -0.524)
- MARY confirms regime shift to HARD_LANDING or LIQUIDITY_CRISIS → Full crisis allocation
The options overlay (0.8% in SPY put spreads) is live and monitored. No adjustment needed this week — VIX at 16.76 means the puts are cheap and staying cheap. That's the point.
Get this research delivered
New analysis, directly to your inbox. Research notifications only.