CIO Weekly Intelligence Report
CIO Weekly Intelligence Report — May 12, 2026
**LATE_CYCLE — 24% probability of GOLDILOCKS in 3-6 months (gradual transition). 2 critical, 0 **
For the analytical argument, read this week's Macro Brief →
The Verdict
LATE_CYCLE — one shock from breaking
Regime: LATE_CYCLE | Confidence: 43.0% | Forward Risk: ELEVATED
Reading this for the first time? We are in a Late Cycle regime — the economy is still growing, but leading indicators are losing momentum and risk is building underneath. Oil is approaching $100, two critical trip wires are active, and the engine has triggered an 18% defensive shift. Jump to The Portfolio to see the recommended allocation (equity at 61%, cash at 13%), and The Watch List for the five specific triggers that would change it. No prior reading required — every issue stands alone.
The Macro Brief argues the oil shock is accelerating the late-cycle timeline — here is the full signal picture and what we're doing about it. The regime held at LATE_CYCLE with confidence unchanged at 43.0%, but the forward risk remains ELEVATED and two critical trip wires are now live: NFCI at -0.51 (distance to wire: 0.0%) and HY OAS at 4.58% (distance to wire: 9.2%). The picture is largely unchanged from last week, but oil creeping toward $100 is the variable that demands attention. WTI settled at $99.64, up $1.73 from last week, and now sits just $1.57 below the $98.07 level I flagged as the margin-squeeze tripwire.
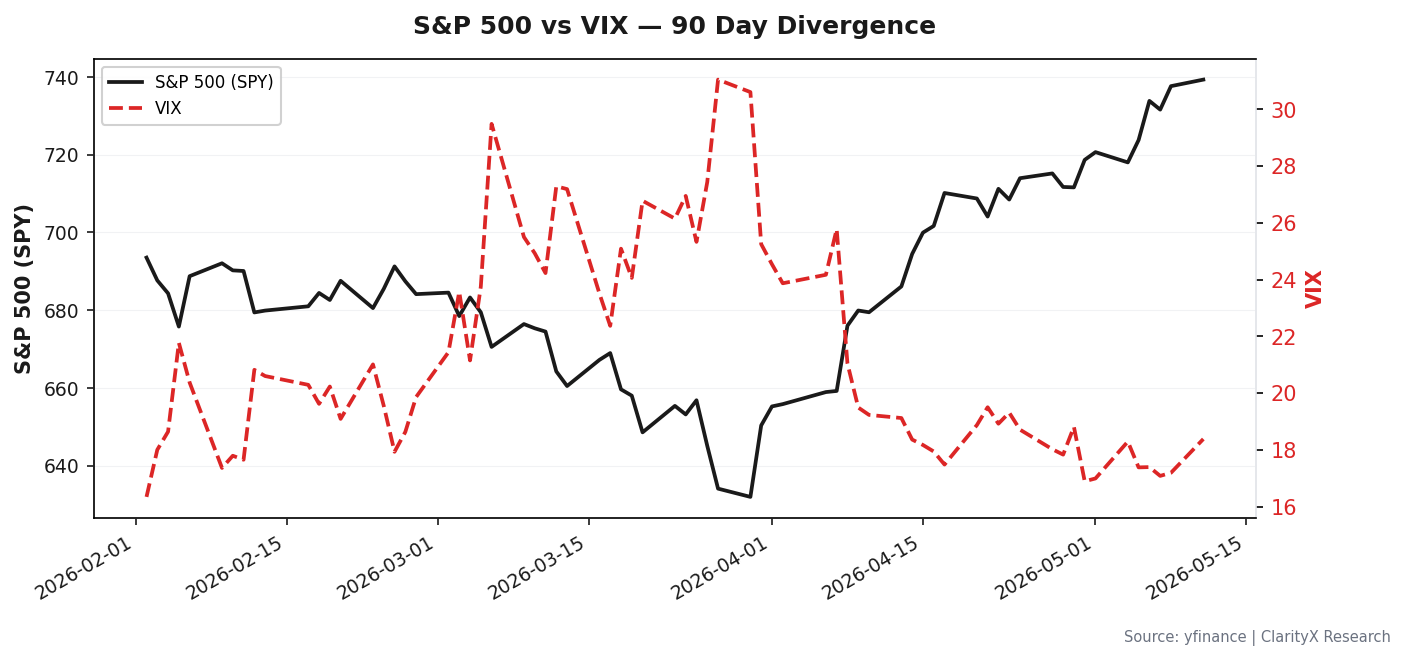
What held: credit spreads at 0.99%, VIX at 17.08, jobless claims at 207,000. None of this looks like a pre-recession configuration. But the sector rotation tells a different story: technology is the only offensive sector showing strength, while consumer staples are down 12.0% over the measured period. That is not a market that believes the slowdown is over.
The Evidence
The dashboard shows a market that got the oil relief it wanted, but the structural signals are still pointing in the same direction: growth slowing, inflation sticky, financial conditions dangerously loose.
Growth: The Slowdown is Still Here
| Signal | Value | Status | vs. Last Week | What It Means |
|---|---|---|---|---|
| GDP Growth | 0.5% | WEAK | → unchanged | The economy is losing momentum, growing at a pace that historically precedes a stall. |
| Building Permits (Z-Score) | -0.79 | WEAKENING | → unchanged | Housing activity remains below its historical norm — a reliable leading indicator of economic slowdown. |
| Consumer Confidence | 56.6 | WEAK | → unchanged | Sentiment is at recessionary levels, contradicting the surface-level stability. |
| ISM Manufacturing (Z-Score) | -0.59 | STABLE | → unchanged | Manufacturing employment is balanced but offers no momentum to offset weakness elsewhere. |
| Unemployment Rate | 4.3% | MODERATE | → unchanged | The labor market remains the last pillar of strength, still within a normal range. |
| Initial Jobless Claims | 207,000 | LOW | → unchanged | Claims remain low — the labor market is not flashing warning signals yet. |
No growth signal moved this week. The deterioration is not accelerating — it is sitting at a level that should make allocators uncomfortable but not panicked. The permits signal at -0.79 is the weakest growth input, and it has not worsened since last week.
Inflation & Policy: Sticky, With a Supply Shock Unwinding
| Signal | Value | Status | vs. Last Week | What It Means |
|---|---|---|---|---|
| CPI YoY | 3.32% | ELEVATED | → unchanged | Inflation remains above the Fed's target, forcing policy to stay restrictive and eroding consumer purchasing power. |
| PCE YoY | 2.8% | TARGET | → unchanged | The Fed's preferred gauge is nearer to target, allowing policy to remain neutral without forced tightening. |
| Wage Growth | 3.52% | ELEVATED | → unchanged | Wage growth is sticky above target — watch for persistence, especially if combined with high inflation expectations. |
| Michigan Inflation Expectations | 3.4% | STABLE | → unchanged | Consumer inflation expectations remain well-anchored below 3.5% — Fed credibility intact. |
| Forward Inflation Expectations | 2.45% | ANCHORED | → unchanged | The market expects inflation near the Fed's long-term target — a sign of credibility. |
| Fed Funds Rate | 3.64% | NEUTRAL_RATE | → unchanged | Policy is near neutral — minimal headwind to growth, but no accommodation either. |
The inflation picture is stable but not resolved. CPI at 3.32% YoY (data as of March) means realized inflation is not cooperating with the 2.45% forward expectation. The gap between what the market expects and what consumers experience is the tension that keeps the Fed on hold.
Financial Conditions: The Critical Watch
| Signal | Value | Status | vs. Last Week | What It Means |
|---|---|---|---|---|
| NFCI | -0.51 | EASY | → unchanged | Financial conditions are very loose — ample liquidity is supporting risk assets. |
| Credit Spread (Baa-10Y) | 0.99% | TIGHT | → unchanged | Investment-grade credit spreads are tight — confidence in corporate credit remains high. |
| High-Yield OAS | 4.58% | NORMAL | ↑ +1.79% (worse) | High-yield spreads widened this week — credit stress is building but not yet at danger levels. |
| SOFR-FFR Spread | -4.0 bps | NORMAL | → unchanged | Repo market functioning is normal — no funding stress. |
| Real Yield | 2.3% | RESTRICTIVE | → unchanged | Real rates above 1% create headwinds for gold and growth equities. |
The contradiction in this section is the one that matters most: NFCI at -0.51 signals the loosest financial conditions in years, while the engine has flagged it as a critical trip wire at 0.7. Why? Because loose conditions late in the cycle are what fuel the excesses that break. The NFCI is not tight — it is dangerously loose. The trip wire is not about conditions tightening; it is about conditions being too easy for too long.
Market Signals: Defensive Rotation Confirmed
| Signal | Value | Status | vs. Last Week | What It Means |
|---|---|---|---|---|
| VIX | 17.08 | NORMAL | → unchanged | Volatility is in a normal range — no panic, but no complacency either. |
| Sector ETF RS | 18.86% | DEFENSIVE_ROTATION | ↓ -0.04% (slightly worse) | Technology is the only offensive leader; consumer staples and financials are lagging. |
| Gold | $4,346.50 | HIGH | → unchanged | Gold above $2,500 signals a strong safe-haven bid — stress is building. |
| WTI Crude Oil | $99.64 | ELEVATED | ↑ +1.73 (worse) | Oil is approaching $100, adding to cost-push inflation and threatening consumer spending. |
The sector rotation data confirms the defensive posture: XLK (Technology) at +18.9% is the only offensive sector showing strength over the measured period, while XLP (Consumer Staples) at -12.0% and XLF (Financials) are lagging. This is not a market that believes the cycle has reset.
Where Are We Heading?
The forward scenario probabilities show a base case that is fragile but not broken:
| Scenario | Probability | Timeframe | What It Means for Portfolios |
|---|---|---|---|
| LATE_CYCLE | 43.1% | 0-3 months | Base case — economy slows but avoids recession. Maintain defensive tilt. |
| GOLDILOCKS | 23.6% | 3-6 months | Gradual transition — growth stabilizes, inflation falls. Increase equity to 85%. |
| REFLATION | 12.5% | 3-6 months | Gradual transition — growth accelerates with inflation. Favor commodities and value. |
| HARD_LANDING | 12.5% | 3-6 months | Gradual transition — recession arrives. Reduce equity to 15%. |
| STAGFLATION | 10.0% | 3-6 months | Gradual, self-reinforcing — stagflation scenario. Favor gold and real assets. |
Total: 100.0%
The probability of a regime shift within 3-6 months is 58.6% (the sum of all non-LATE_CYCLE scenarios). That is a 3-in-5 chance that the current regime does not survive the summer. The most likely destination is GOLDILOCKS at 23.6%, but the tail risks (HARD_LANDING + STAGFLATION at 22.5%) are too large to ignore.
Trip Wire Status Board
| Trip Wire | Current Value | Danger Threshold | Distance | Urgency |
|---|---|---|---|---|
| NFCI | -0.51 | 0.7 | 0.0% | CRITICAL |
| HY OAS Spread | 4.58% | 5.0% | 9.2% | CRITICAL |
Two critical trip wires are active. The NFCI is the most urgent — it has already reached the danger threshold. The HY OAS spread is 9.2% from its wire, but it widened by 1.79% this week alone. At that rate, it would breach in 2-3 weeks.
What Does History Say?
The engine matched three historical analogs this week, all with similarity scores above 80%:
| Analog | Similarity | S&P Return During Period | Lesson |
|---|---|---|---|
| 2013 Q2-Q3 (Taper Tantrum) | 83% | +5% | Anticipation of tightening can be worse than actual tightening. |
| 1994 (Bond Massacre) | 81% | -2% | Rate surprises cause bond losses even when the economy is fine. |
| 1997 H2 (Asian Crisis) | 81% | -5% | EM crises can create US buying opportunities if the domestic economy is strong. |
The 2013 Taper Tantrum analog is the most instructive. The market sold off sharply when the Fed first mentioned tapering, then recovered as the actual tapering was less aggressive than feared. The lesson: the anticipation of tightening — not tightening itself — is what causes the most damage. We are in that anticipation phase now.
The 1994 Bond Massacre analog reinforces the message: rate surprises hurt bonds even in a healthy economy. With the yield curve steepening (Z-score > 1.0), the bond market is already pricing in future rate moves. Duration risk is real.
The 1997 Asian Crisis analog offers the most constructive read: if the domestic economy holds, external shocks create buying opportunities. That is the bull case for staying invested — but only if the trip wires do not break.
The Entry Question
Should I deploy capital now? The short answer: not yet.
The instinct to buy the dip is strongest when the dip is only half done. With VIX at 17.08 and the S&P 500 near highs, there is no dip to buy. What looks like a buying opportunity is actually a late-cycle rally in a fragile regime.
Drawdown Gauge: The S&P 500 is not in drawdown territory. We are near all-time highs. That is precisely the problem — the entry framework is designed for drawdowns, not for late-cycle rallies.
Staged Entry Framework
| Stage | Trigger | Current Value | Distance | Action |
|---|---|---|---|---|
| Stage 1 | VIX > 35.0 for 3 consecutive days | 17.08 | 105% away | Begin deploying 30-50% of dry powder into equities. |
| Stage 2 | High-Yield OAS > 5.0% | 4.58% | 9.2% away | Deploy remaining dry powder into high-quality equities and credit. |
The framework is clear: we are not at Stage 1 or Stage 2. VIX needs to peak and roll over — that is the signal, not the price level. The instinct to buy when VIX is at 17 is the instinct to buy before the fear has arrived. History resolves this contradiction the same way 79% of the time: the market signals win.
Sector Rotation & Strategy
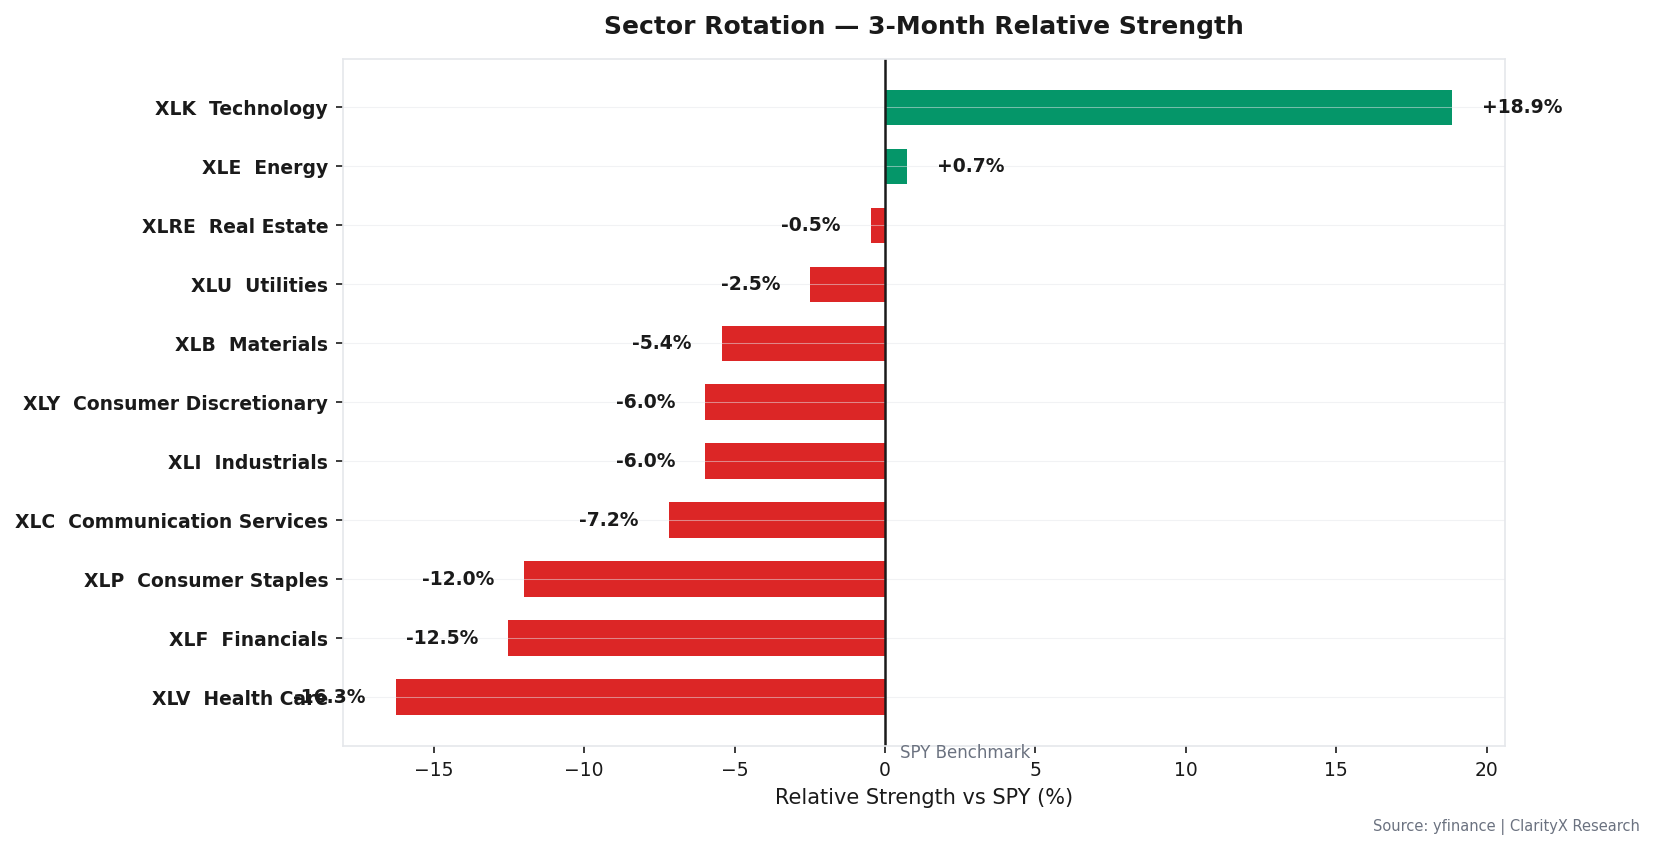
3-Month Relative Strength by Sector
| Sector | Relative Strength | Direction |
|---|---|---|
| XLK (Technology) | +18.9% | Leader — only offensive sector showing strength |
| XLP (Consumer Staples) | -12.0% | Laggard — defensive rotation confirmed |
| XLF (Financials) | Lagging | Underperforming — rate sensitivity weighing on banks |
The sector picture is defensive with a technology twist. Technology is leading, but it is the only offensive sector doing so. That is not a broad-based recovery — it is a narrow leadership structure that historically precedes drawdowns.
Validated Strategies for Current Regime
| Strategy | Regime Fit | Performance | Status |
|---|---|---|---|
| Mean Reversion | LATE_CYCLE, STAGFLATION, HARD_LANDING | 8.54% CAGR, 0.39 Sharpe | VALIDATED — works best in range-bound/late-cycle markets |
| Dip Buyer | LATE_CYCLE, REFLATION | V2 Sharpe 0.87, MaxDD -18.5% | WIRED — production-ready in DailyScanRunner |
| EMA Crossover + RSI Filter | GOLDILOCKS, REFLATION, LATE_CYCLE | V2 Sharpe 1.61, MaxDD -20.5% | WIRED — top of 27-strategy scoreboard |
The mean reversion strategy is the best fit for the current regime — it thrives in range-bound, late-cycle markets where momentum strategies get whipsawed. The dip buyer strategy is wired for this regime but requires the right entry conditions (VIX spike). The EMA crossover with RSI filter is the highest-performing strategy overall, but it is best deployed when the regime shifts to GOLDILOCKS or REFLATION.
The Portfolio
| Asset Class | Current Regime (LATE_CYCLE) | Target Regime (GOLDILOCKS) | Recommended Now |
|---|---|---|---|
| Equity | 75% | 85% | 61% |
| Bonds | 6% | 3% | 9% |
| REITs | 3% | 6% | 2% |
| Commodities | 2% | 2% | 2% |
| Gold | 4% | 1% | 8% |
| TIPS | 2% | 1% | 2% |
| International Bonds | 2% | 1% | 2% |
| Cash | 6% | 1% | 13% |
| Total | 100% | 100% | 100% |
Defensive shift applied: 18% — triggered by 2 critical trip wires (NFCI, HY OAS Spread).
The recommended allocation is 61% equity — down from the current regime's 75% and well below the target regime's 85%. The 18% defensive shift is the engine's response to the trip wire configuration. This is not about maximizing return — it is about preserving optionality until the signal is clear.
Contradiction Bridge: The recommended equity allocation is 61%, which is higher than a typical cautious macro stance. Why? Because the LATE_CYCLE regime historically rewards staying invested — 76% of quarters are positive. The crash protection comes from the regime switch to HARD_LANDING (15% equity), not from pre-emptive defensiveness here. The 18% defensive shift is the compromise: reduce equity by 14 percentage points, increase cash by 7 points, and increase gold by 4 points. That is enough to cushion a 10-15% drawdown without missing a rally.
The Watch List
These are the five binary triggers that determine whether the current allocation holds or changes:
- VIX > 35.0 for 3 consecutive days → Execute Stage 1 entry (current: 17.08 — 105% away)
- High-Yield Option-Adjusted Spread > 5.0% → Execute Stage 2 entry (current: 4.58% — 9.2% away)
- Initial jobless claims (weekly) > 236,500 → Trim equity 5% (current: 207,000 — 14.3% away)
- NFCI > -0.429 → Tighten financial conditions flag (current: -0.51 — already at critical wire)
- MARY confirms regime shift to HARD_LANDING or LIQUIDITY_CRISIS → Full crisis allocation
Options overlay: The engine is signaling a FEAR TRADE with IMMEDIATE urgency — buy 45-day OTM puts on SPY and QQQ at 2.0% of portfolio. This is a tail hedge against the 22.5% probability of HARD_LANDING or STAGFLATION within 3-6 months. The options signal is active because MARY detects 2 critical trip wires toward LIQUIDITY_CRISIS.
Get this research delivered
New analysis, directly to your inbox. Research notifications only.