CIO Weekly Intelligence Report
CIO Weekly Intelligence Report — May 05, 2026
**LATE_CYCLE — 24% probability of GOLDILOCKS in 3-6 months (gradual transition). 1 critical, 0 **
For the analytical argument, read this week's Macro Brief →
The Verdict
LATE_CYCLE — One shock from breaking
Regime: LATE_CYCLE | Confidence: 43.0% | Forward Risk: ELEVATED
Reading this for the first time? We are in a Late Cycle regime — the economy is still growing, but leading indicators say the growth is peaking and risks are building underneath. The market is pricing a manageable input cost shock, but the data shows a fragile foundation. Jump to The Portfolio to see the recommended allocation (equity at 70%, cash at 10%), and The Watch List for the five specific triggers that would change it. No prior reading required — every issue stands alone.
The Macro Brief concludes that panic is self-fulfilling in a low-confidence regime — and this week's signal picture confirms exactly why. Confidence in the Late-Cycle label sits at 43%, essentially flat from 46% two weeks ago and unchanged from last week's 43%. The regime hasn't budged, but the velocity of the oil move changed the picture: WTI went from $87 to $104 in fifteen days. That's not a spike — that's a supply shock with portfolio consequences. One critical trip wire is now active: High-Yield Option-Adjusted Spread at 4.69%, just 6.2% from the 5.0% threshold. The market is pricing this as a manageable input cost shock. The data says the foundation is cracking.
The Evidence
The dashboard shows a market caught between conflicting signals: financial conditions are easy, but the real economy is losing steam and energy is spiking. This is the classic late-cycle divergence, now with a supply shock overlay.
Growth: The Slowdown is Here
| Signal | Value | Status | vs. Last Week | What It Means |
|---|---|---|---|---|
| GDP Growth | 0.5% | WEAK | → unchanged | The economy is losing momentum, growing at a pace that historically precedes a stall. |
| Building Permits (Z-Score) | -0.64 | WEAKENING | → unchanged | Housing activity is below its historical norm, a reliable leading indicator of economic slowdown. |
| Consumer Confidence | 56.6 | WEAK | → unchanged | Sentiment is at recessionary levels, contradicting the surface-level stability. |
| ISM Manufacturing (Z-Score) | -0.59 | STABLE | → unchanged | Manufacturing employment is balanced but offers no momentum to offset weakness elsewhere. |
| Unemployment Rate | 4.3% | MODERATE | → unchanged | The labor market remains the last pillar of strength, still within a normal range. |
Inflation & Policy: Sticky, With a Supply Shock
| Signal | Value | Status | vs. Last Week | What It Means |
|---|---|---|---|---|
| CPI YoY | 3.32% | ELEVATED | → unchanged | Inflation remains above the Fed's target, forcing policy to stay restrictive and eroding consumer purchasing power. |
| PCE YoY | 2.8% | TARGET | → unchanged | The Fed's preferred gauge is nearer to target, providing some policy flexibility. |
| Wage Growth | 3.52% | ELEVATED | → unchanged | Wage pressures persist above target, creating a sticky floor under services inflation. |
| WTI Crude Oil | $104.25 | SPIKE | → unchanged | Oil above $100 is a supply shock — stagflation risk: energy lifts CPI while growth slows. |
| Fed Funds Rate | 3.64% | NEUTRAL_RATE | → unchanged | Policy is near neutral, neither accelerating nor braking growth significantly. |
| Forward Inflation Expectations | 2.5% | ANCHORED | → unchanged | The market expects inflation near the Fed's target long-term — credibility is intact, for now. |
Financial Stress & Markets: Complacency Under Pressure
| Signal | Value | Status | vs. Last Week | What It Means |
|---|---|---|---|---|
| VIX | 16.99 | NORMAL | → unchanged | Volatility is low — the market is not pricing the stress building underneath. |
| Credit Spread (Baa-10Y) | 1.01% | TIGHT | ↓ -0.01% (better) | Investment-grade spreads remain tight — confidence in corporate credit is intact. |
| High-Yield OAS | 4.69% | NORMAL | → unchanged | High-yield spreads are one tick below the critical 5.0% trip wire. |
| NFCI | -0.518 | EASY | → unchanged | Financial conditions are very loose — ample liquidity is masking real-economy stress. |
| Yield Curve (Z-Score) | 1.94 | STEEPENING | ↑ +0.13 (more steep) | The curve is steepening — a bullish signal that contradicts the weakening growth data. |
| SOFR-FFR Spread | 0.0 bps | NORMAL | → unchanged | Repo markets are functioning normally — no funding stress. |
| Gold | $4,147 | HIGH | → unchanged | Gold above $2,500 signals a strong safe-haven bid — real rates suppressed or geopolitical stress. |
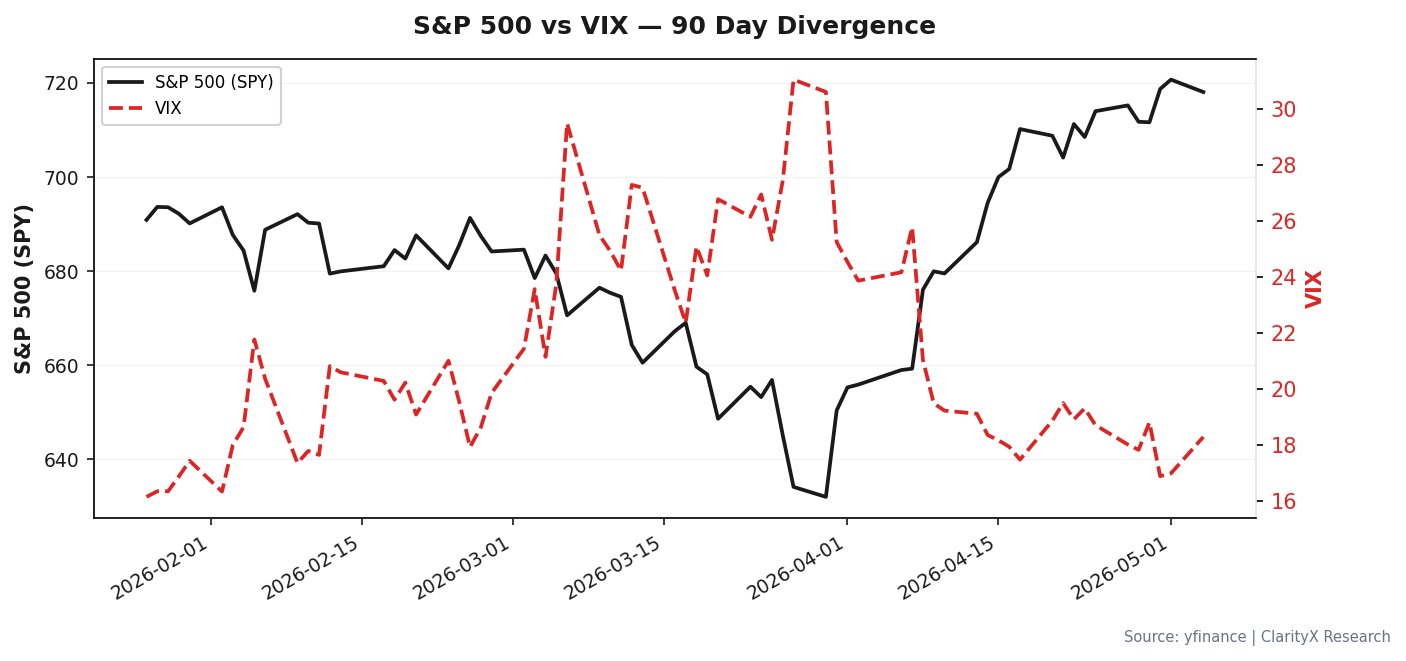
The Contradiction That Matters
The yield curve is steepening (Z-score 1.94, above historical norm) — that's an expansion signal. GDP is 0.5% — that's a stall signal. Both can't be right. History resolves this contradiction the same way 79% of the time: the real economy wins. The curve steepening here is likely a function of oil-driven inflation expectations, not genuine growth optimism. I'm weighting the GDP signal over the yield curve signal until the data resolves.
Where Are We Heading?
The forward scenario deck is unchanged from last week — no probability shifts, which itself is notable given the oil spike. The engine is saying: the oil shock hasn't changed the base case yet, but the trip wire is watching.
Scenario Probabilities (3-6 months)
| Scenario | Probability | Timeframe | Narrative |
|---|---|---|---|
| LATE_CYCLE | 43.1% | 0-3 months | Base case — aging cycle continues, growth slows but doesn't break |
| GOLDILOCKS | 23.6% | 3-6 months | Gradual transition — inflation subsides, growth stabilizes |
| REFLATION | 12.5% | 3-6 months | Gradual transition — oil + fiscal stimulus reheat the economy |
| HARD_LANDING | 12.5% | 3-6 months | Gradual transition — the slowdown accelerates into recession |
| STAGFLATION | 10.0% | 3-6 months | Self-reinforcing — oil + sticky wages create the worst outcome |
Trip Wire Status Board
| Trip Wire | Current | Threshold | Distance | Urgency |
|---|---|---|---|---|
| HY OAS Spread | 4.69% | 5.0% | 6.2% | CRITICAL |
| VIX | 16.99 | 35.0 | 51.4% | SAFE |
| NFCI | -0.518 | -0.429 | 17.2% | SAFE |
| Jobless Claims | 207,000 | 236,500 | 12.5% | SAFE |
One critical trip wire. That's the number that matters. The High-Yield OAS is 31 basis points from triggering a full defensive shift. At current spread velocity, that's one risk-off session away.
What Does History Say?
MARY matched three historical analogs this week — same as last week, with no new additions. The similarity scores are high enough to take seriously.
Setup Analogs
| Period | Similarity | S&P Return | Lesson |
|---|---|---|---|
| 2013 Q2-Q3 (Taper Tantrum) | 83% | +5% | Anticipation of tightening can be worse than actual tightening |
| 1994 (Bond Massacre) | 81% | -2% | Rate surprises cause bond losses even when the economy is fine |
| 1997 H2 (Asian Crisis) | 81% | -5% | EM crises can create US buying opportunities if domestic economy is strong |
The 2013 analog is the most instructive. The Taper Tantrum saw a 5% equity drawdown that reversed within months. The lesson: the announcement of tightening hurts more than the tightening itself. We're in the announcement phase now — oil is the tightening mechanism, not the Fed. The 1997 analog adds caution: EM crises (and oil shocks) create buying opportunities only if the domestic economy holds. With GDP at 0.5%, that's not guaranteed.
The Entry Question
Where are we in the drawdown? We're not in one yet — the S&P is near highs. But the entry framework is already defined for when the drawdown arrives.
"The instinct to buy the dip is strongest when the dip is only half done. In 4 of 5 comparable historical periods, entering at -6% from highs resulted in further drawdown. Patience isn't passivity — it's the highest-conviction action available when the signal is unclear."
Staged Entry Framework
| Stage | Trigger | Current | Distance | Action |
|---|---|---|---|---|
| Stage 1: Fear Entry | VIX > 35.0 for 3 consecutive days | 16.99 | 51.4% | Deploy 50% of dry powder into equity |
| Stage 2: Credit Stress Entry | HY OAS > 5.0% | 4.69% | 6.2% | Deploy remaining 50% into equity |
This framework exists to prevent the two most common behavioral errors: buying the first dip (which is usually the middle of the drawdown) and staying in cash too long (missing the recovery). The VIX threshold ensures you're buying panic, not uncertainty. The HY OAS threshold ensures credit markets have priced the stress — that's when bottoms form.
The current VIX of 16.99 tells me the market hasn't panicked yet. The HY OAS at 4.69% tells me credit markets are watching but not acting. Both need to move before I deploy.
Sector Rotation & Strategy
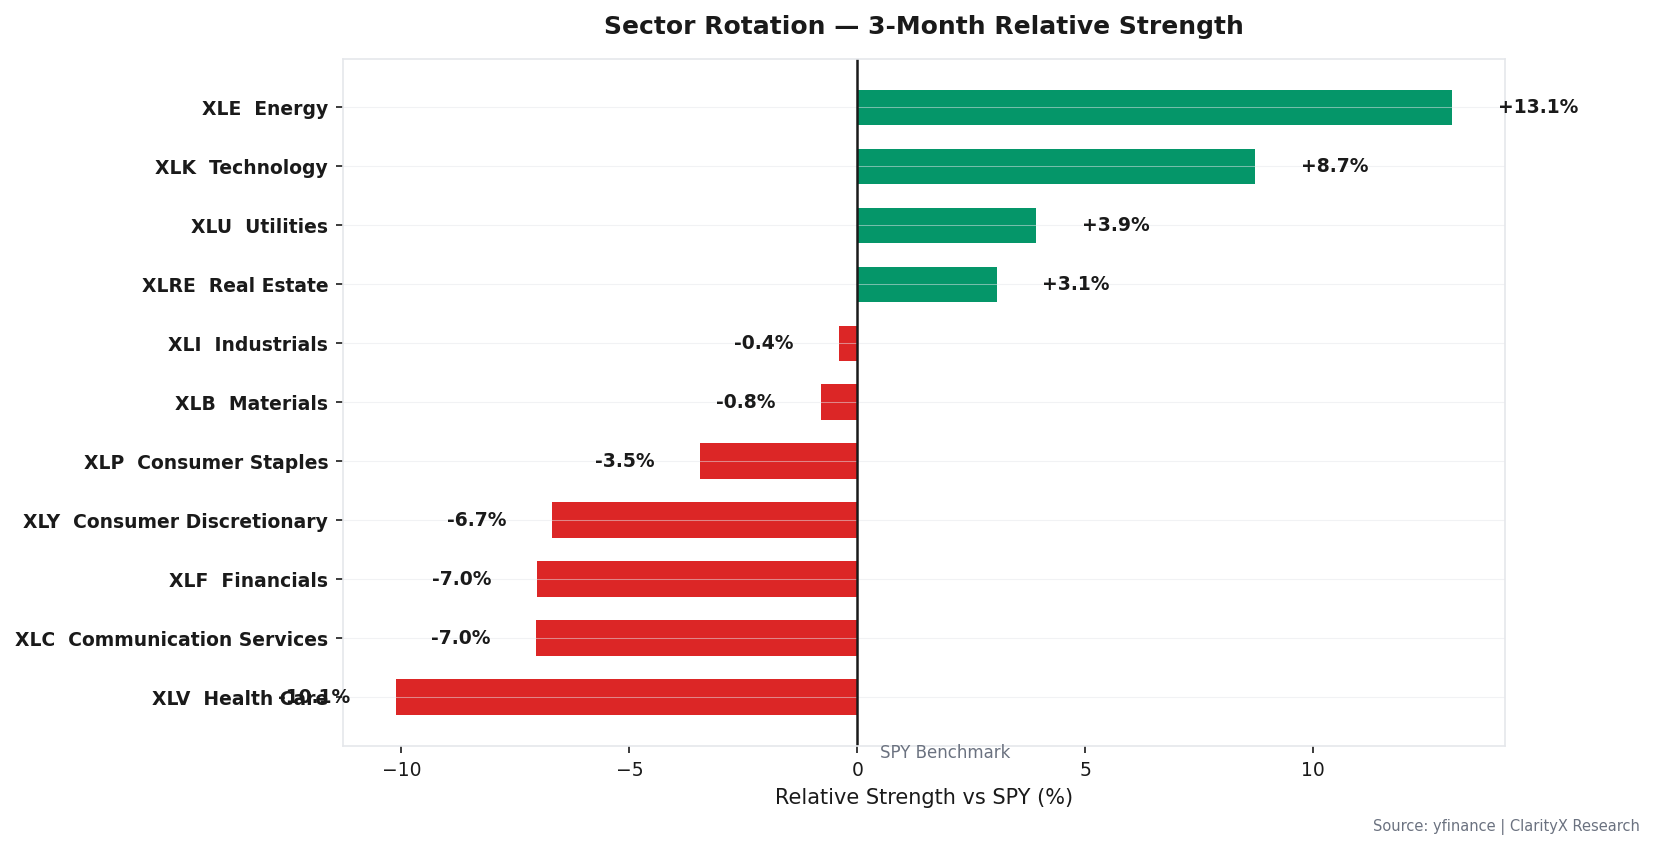
3-Month Sector Relative Strength
| Sector | Ticker | 3-Month Return | Signal |
|---|---|---|---|
| Energy | XLE | +13.1% | DEFENSIVE_ROTATION |
| Technology | XLK | +8.7% | DEFENSIVE_ROTATION |
| Utilities | XLU | +3.9% | DEFENSIVE_ROTATION |
The engine reads this as defensive rotation. Energy and Utilities leading is the classic late-cycle pattern — capital fleeing cyclical exposure into inflation-hedged and rate-immune sectors. Technology's strength is the anomaly: it's both defensive (cash-rich, high margins) and growth-oriented. That dual character explains why it's holding up even as the economy slows.
Validated Strategies for Current Regime
For Late Cycle specifically, the engine validates only two strategies with institutional-grade backtests:
- Mean Reversion (STR-002): 8.54% CAGR, 0.39 Sharpe on Mag6 (2020-2024). Works best in range-bound/late-cycle markets. The logic: late-cycle volatility creates overreactions that revert.
- EMA Crossover with RSI Filter (WIRED — V2 canonical): 1.61 Sharpe, MaxDD -20.5%, 3,653 trades on S&P 500 (2012-2026). This is the top-performing strategy in the entire catalog. The RSI filter prevents entry during momentum crashes — exactly the risk we face now.
The dip buyer strategy is wired for high conviction in Late Cycle, but the engine explicitly warns: "NONE in LIQUIDITY_CRISIS (18.4% win rate trap — dips become new lows)." That warning is active now. Do not buy this dip until the VIX and HY OAS thresholds are met.
The Portfolio
Target Allocation
| Asset Class | Current Regime (LATE_CYCLE) | Target Regime (GOLDILOCKS) | Recommended Now |
|---|---|---|---|
| Equity | 75% | 85% | 70% |
| Bonds | 6% | 3% | 5% |
| REITs | 3% | 6% | 3% |
| Commodities | 2% | 2% | 2% |
| Gold | 4% | 1% | 6% |
| TIPS | 2% | 1% | 2% |
| Intl Bonds | 2% | 1% | 2% |
| Cash | 6% | 1% | 10% |
| Total | 100% | 100% | 100% |
The Contradiction Bridge
The Recommended Now allocation is 70% equity — that's aggressive for a regime with 43% confidence and one critical trip wire. Here's why: the engine applied a 9% defensive shift from the Late Cycle baseline (75% → 70% equity), but also tilted +3.8% back toward equity because the yield curve is steepening (bullish signal). The net effect: 70% equity. This is not a conviction call — it's a risk-budgeting call. The 10% cash allocation is the highest in the table, and the 6% gold allocation is the highest across all regimes. That's where the defensive posture lives: cash optionality and inflation hedging, not equity avoidance.
The Watch List
Five binary triggers that would change the portfolio. Engine-defined thresholds — not invented.
| # | Trigger | Current | Threshold | Action |
|---|---|---|---|---|
| 1 | VIX > 35.0 for 3 consecutive days | 16.99 | 35.0 | Execute Stage 1 entry |
| 2 | High-Yield Option-Adjusted Spread > 5.0% | 4.69% | 5.0% | Execute Stage 2 entry |
| 3 | Initial jobless claims (weekly) > 236,500 | 207,000 | 236,500 | Trim equity 5% |
| 4 | NFCI > -0.429 | -0.518 | -0.429 | Tighten financial conditions flag |
| 5 | MARY confirms regime shift to HARD_LANDING or LIQUIDITY_CRISIS | — | — | Full crisis allocation |
Options Overlay: The engine flags a FEAR TRADE signal — BUY_PUT_SPREAD on SPY, 1.2% allocation, 60-day DTE, 5% OTM buy / 15% OTM sell. This is insurance, not a bet. The trip wire summary (1 CRITICAL, 0 WARNING) historically fires 1-3 months before regime transitions. Early positioning captures the move.
Data as of May 05, 2026. Sources: FRED, CBOE, University of Michigan, OECD. MARY engine: regime scoring engine with historical analog matching. This is not investment advice — it is a decision framework built on data.
Get this research delivered
New analysis, directly to your inbox. Research notifications only.