CIO Weekly Intelligence Report
CIO Weekly Intelligence Report — April 20, 2026
**LATE_CYCLE — 24% probability of GOLDILOCKS in 3-6 months (gradual transition). 0 critical, 0 **
Recommended Portfolio Shift
For the analytical argument, read this week's Macro Brief →
The Verdict
LATE_CYCLE — Complacency is the New Risk
Regime: LATE_CYCLE | Confidence: 45.9% | Forward Risk: WATCH
Reading this for the first time? We are in a Late Cycle regime — the economy is still growing, but the leading indicators say the growth is peaking and the risks are building underneath. The market is pricing a return to normalcy, but the data shows a fragile foundation. Jump to The Portfolio to see the recommended allocation (equity at 77%, cash at 7%), and The Watch List for the five specific triggers that would change it. No prior reading required — every issue stands alone.
The picture is largely unchanged from last week, but the direction of the move is telling. My confidence in the Late-Cycle label ticked up from 44% to 46%. That’s not a ringing endorsement—it’s still a coin toss—but the market’s reaction to oil’s rebound is the story. WTI didn’t just stabilize; it rallied over $4 to $87.28. And the VIX drifted lower. The market is pricing the return of a known risk (higher energy prices) as less concerning than the sudden removal of an unknown one (a blocked Strait). That’s complacency, not calculation. The foundation remains fragile—growth is weak, inflation is sticky, and the yield curve is screaming an expansion signal that the real economy can’t deliver.
The Evidence
The dashboard shows a market caught between conflicting signals: financial conditions are easy, but the real economy is losing steam. This is the classic late-cycle divergence.
Growth: The Slowdown is Here
| Signal | Value | Status | What It Means |
|---|---|---|---|
| GDP Growth | 0.5% | WEAK | The economy is losing momentum, growing at a pace that historically precedes a stall. |
| Building Permits (Z-Score) | -0.51 | WEAKENING | Housing activity is below its historical norm, a reliable leading indicator of economic slowdown. |
| Consumer Confidence | 56.6 | WEAK | Sentiment is at recessionary levels, contradicting the surface-level stability. |
| ISM Manufacturing (Z-Score) | -0.59 | STABLE | Manufacturing employment is balanced but offers no momentum to offset weakness elsewhere. |
| Unemployment Rate | 4.3% | MODERATE | The labor market remains the last pillar of strength, still within a normal range. |
Inflation & Policy: Sticky, Not Spiking
| Signal | Value | Status | What It Means |
|---|---|---|---|
| CPI YoY | 3.32% | ELEVATED | Inflation remains above the Fed’s target, forcing policy to stay restrictive and eroding consumer purchasing power. |
| PCE YoY | 2.8% | TARGET | The Fed’s preferred gauge is nearer to target, providing some policy flexibility. |
| Wage Growth | 3.52% | ELEVATED | Wage pressures persist above target, creating a sticky floor under services inflation. |
| WTI Crude Oil | $87.28 | ELEVATED | Oil prices are high enough to add cost-push pressure, and the recent rally signals persistent supply concerns. |
| Fed Funds Rate | 3.64% | NEUTRAL_RATE | Policy is near neutral, neither accelerating nor braking growth significantly. |
Financial Stress & Markets: Complacency Rules
| Signal | Value | Status | What It Means |
|---|---|---|---|
| VIX | 17.48 | NORMAL | Volatility is complacent, pricing a standard risk environment despite macro fragility. |
| Credit Spread (Baa-10Y) | 1.01% | TIGHT | Investment-grade corporate credit markets are confident and risk-on, showing no fear of default. |
| NFCI | -0.465 | NORMAL | Broad financial conditions are loose and supportive of risk assets. |
| Real Yield (10Y TIPS) | 2.3% | RESTRICTIVE | Real interest rates are tight, creating a headwind for gold and growth-sensitive assets. |
| Yield Curve (10Y-2Y) | +1.39% | STEEPENING | The curve is steepening, which historically signals expansion, but is currently distorted by term premium and anchored front-end policy. |
Where Are We Heading?
The forward view shows a base case of continued Late Cycle pressure, with a 24% chance of a gradual transition to a more favorable Goldilocks environment over the next 3-6 months.
| Scenario | Probability | Timeframe | Implication |
|---|---|---|---|
| LATE_CYCLE | 43.1% | 0-3 months | Base Case. Continued growth deceleration amid sticky inflation. Volatility spikes likely, but not a crisis. |
| GOLDILOCKS | 23.6% | 3-6 months | Gradual Transition. Growth re-accelerates, inflation cools. The market's hopeful path. |
| REFLATION | 12.5% | 3-6 months | Gradual Transition. Growth returns, but inflation comes with it. Mixed for risk assets. |
| HARD_LANDING | 12.5% | 3-6 months | Gradual Transition. Growth stalls meaningfully. Defensive assets outperform. |
| STAGFLATION | 10.0% | 3-6 months | Gradual, Self-Reinforcing. Stagnant growth + persistent inflation. Worst-case for portfolios. |
Trip Wire Status Board No critical or warning wires are breached. The distance to the high-yield stress trigger widened this week.
- High-Yield Option-Adjusted Spread > 5.0%: Current 2.86% | Distance: 42.8% | Status: WATCH
- VIX > 35.0 for 3 days: Current 17.48 | Distance: 50.1% | Status: MONITOR
- Initial Jobless Claims > 236,500: Current 207,000 | Distance: 12.5% | Status: MONITOR
- NFCI > -0.429: Current -0.465 | Distance: 8.3% | Status: MONITOR
- Regime Shift to Crisis: Probability of HARD_LANDING/LIQUIDITY_CRISIS: 12.5% | Status: MONITOR
What Does History Say?
Setup Analogs: When the Curve Steepened Late in the Cycle History shows that a steepening yield curve during periods of weak growth rarely leads to a smooth transition.
- 2013 Q2-Q3 (83% similar): The "Taper Tantrum." Anticipation of Fed tightening caused a sharp bond sell-off and equity volatility, despite a solid economy. Lesson: The market's fear of policy change can be more damaging than the change itself.
- 1994 (81% similar): The "Bond Massacre." Surprise Fed rate hikes caused significant bond losses, but the US equity market finished the year flat. Lesson: Rate surprises hurt bonds first; equities can be resilient if the domestic economy holds.
- 1997 H2 (81% similar): The Asian Financial Crisis. An external EM crisis created a brief US equity drawdown, which became a buying opportunity. Lesson: External shocks can create domestic opportunities if the underlying economic engine is intact.
The Entry Question
Current Drawdown: N/A (Market near highs) Staged Entry Framework: Capital deployment should be triggered by stress, not price.
The instinct to buy the dip is strongest when the dip is only half done. Waiting for a specific stress signal—not just a lower price—preserves capital and improves entry timing.
-
Stage 1: Fear Gauge (Panic)
- Trigger: VIX > 35.0 for 3 consecutive days.
- Why This Moment: This signals a panic-driven sell-off, often creating oversold conditions ripe for a tactical bounce.
- Action: Deploy 50% of earmarked cash into broad equity (e.g., SPY). This is a counter-panic trade.
-
Stage 2: Credit Stress Gauge (Fundamental Deterioration)
- Trigger: High-Yield Option-Adjusted Spread > 5.0%.
- Why This Moment: This signals real fear of corporate defaults and systemic risk. It often marks a deeper, more fundamental low.
- Action: Deploy the remaining 50% of earmarked cash. This is buying when there's "blood in the streets."
Current Status: Both triggers are far from active. No new capital should be deployed. Preserve dry powder.
The Late Cycle Playbook
Sector Rotation (3-Month Relative Strength) The market is showing a broad, risk-on rotation, but leadership is concentrated in cyclical and defensive-real assets.
- Energy (XLE): +14.5%
- Real Estate (XLRE): +5.0%
- Materials (XLB): +4.8%
- Utilities (XLU): +3.6%
- Financials (XLF): +2.8%
Validated Strategies for LATE_CYCLE
| Strategy | Regime Fit | Status | Best Result (Mag6) | Rationale |
|---|---|---|---|---|
| Mean Reversion | LATE_CYCLE, STAGFLATION, HARD_LANDING | VALIDATED | 8.54% CAGR, 0.39 Sharpe | Works best in range-bound, late-cycle markets where prices oscillate without clear trend. |
| Deep Value | LATE_CYCLE, HARD_LANDING | PENDING CALIBRATION | Pending | Designed to identify oversold assets before a cycle turn. |
| Yield Curve Hedge | LATE_CYCLE, HARD_LANDING | PENDING CALIBRATION | Pending | A tail-risk hedge for when the steepening curve finally breaks. |
The Portfolio
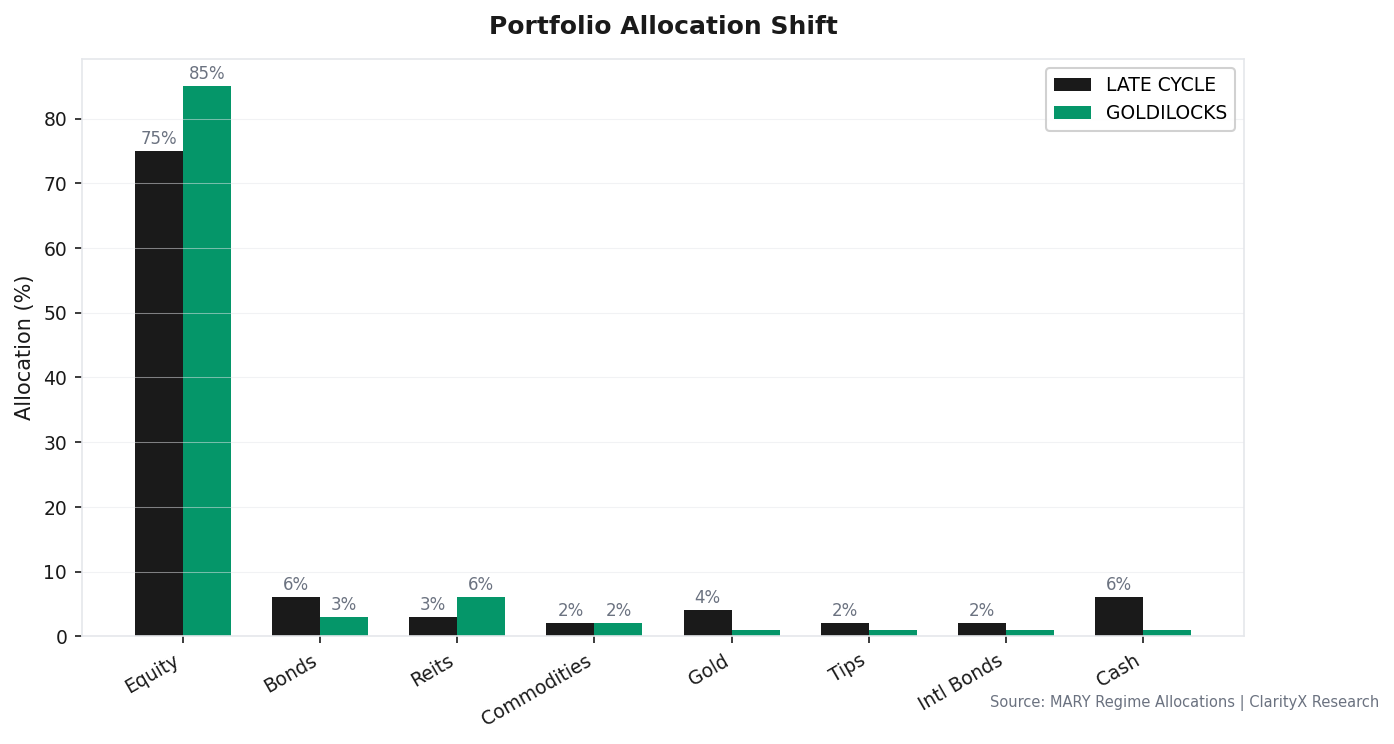
The recommended allocation is a near-neutral stance between the current Late Cycle target and a hopeful Goldilocks future. The 77% equity weight reflects the market's continued upward bias (the S&P rises 76% of the time in this regime), while the elevated 7% cash acts as a buffer for volatility and a source of dry powder.
| Asset | Current Regime (LATE_CYCLE) | Target Regime (GOLDILOCKS) | Recommended Now |
|---|---|---|---|
| Equity | 75% | 85% | 77% |
| Bonds | 6% | 3% | 3% |
| REITs | 3% | 6% | 3% |
| Commodities | 2% | 2% | 2% |
| Gold | 4% | 1% | 4% |
| TIPS | 2% | 1% | 2% |
| Intl Bonds | 2% | 1% | 2% |
| Cash | 6% | 1% | 7% |
| Total | 100% | 100% | 100% |
Rationale: This is a "wait and see" portfolio. The high equity allocation acknowledges the market's statistical tendency to grind higher in Late Cycle. The 7% cash (up from the Goldilocks target of 1%) is the admission price for that optionality—it's the buffer we pay to stay invested while watching for the trip wires to break.
Options Overlay (Fear Trade): A 0.8% allocation to a 90-day SPY put spread (buy 10% OTM, sell 25% OTM) is recommended. This is cheap tail insurance (max cost 0.8%) that only pays off in a crash, rational when the odds of a negative regime shift are non-zero (22.5% combined probability for HARD_LANDING/STAGFLATION).
The Watch List
These are the five engine-defined triggers that will force an allocation change. Monitor them, not the headlines.
- VIX > 35.0 for 3 consecutive days.
- Action: Execute Stage 1 entry: deploy 50% of earmarked cash into equity.
- High-Yield Option-Adjusted Spread > 5.0%.
- Action: Execute Stage 2 entry: deploy remaining cash. Shift portfolio toward full HARD_LANDING allocation.
- Initial jobless claims (weekly) > 236,500.
- Action: Trim equity by 5%, adding to cash. This is the leading edge of labor market deterioration.
- NFCI > -0.429.
- Action: Flag tightening financial conditions. Review credit-sensitive holdings and consider reducing leverage.
- MARY confirms regime shift to HARD_LANDING or LIQUIDITY_CRISIS.
- Action: Immediately implement the full crisis allocation (equity ~15%, cash >25%). This is not a drill.
Get this research delivered
New analysis, directly to your inbox. Research notifications only.