CIO Weekly Intelligence Report
CIO Weekly Intelligence Report — April 17, 2026
**LATE_CYCLE — 24% probability of GOLDILOCKS in 3-6 months (gradual transition). 0 critical, 0 **
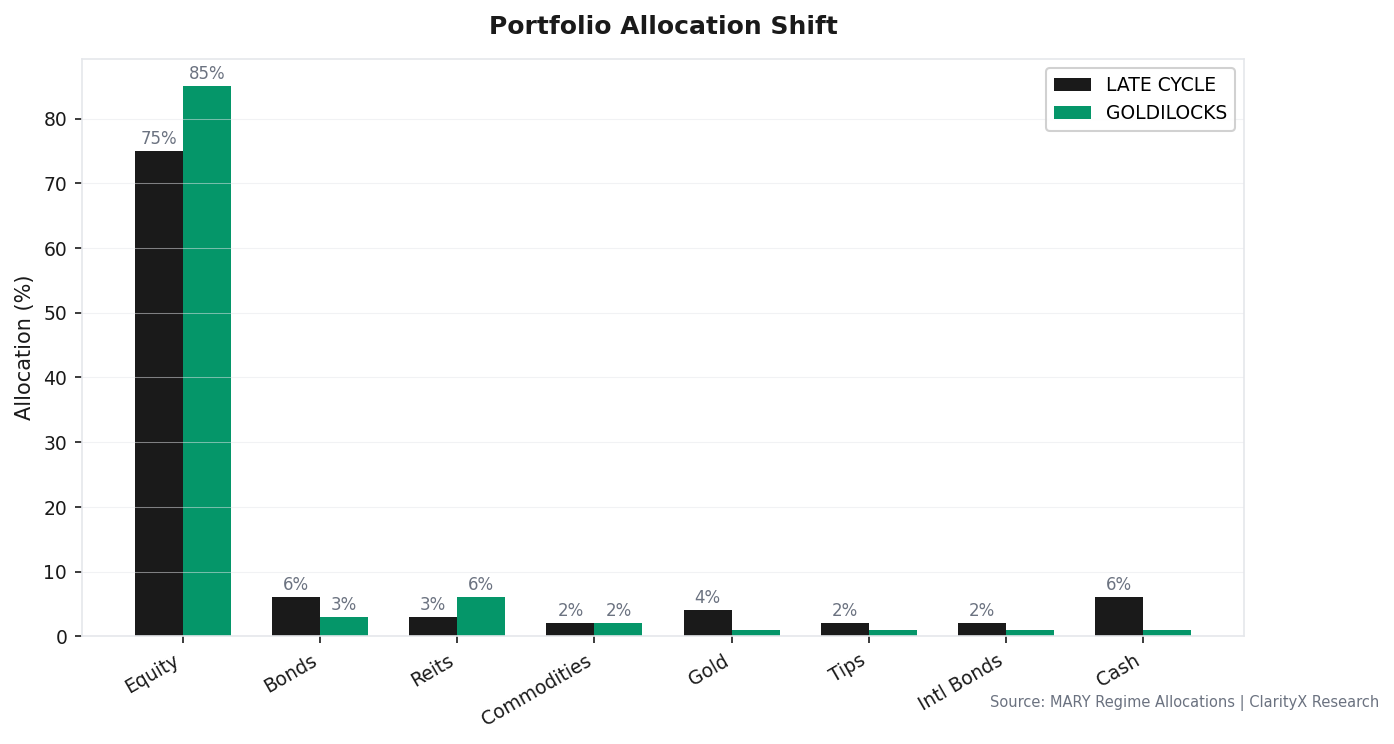
Recommended Portfolio Shift
For the analytical argument, read this week's Macro Brief →
The Verdict
LATE_CYCLE — The Danger Receded, The Fragility Remains
Regime: LATE_CYCLE | Confidence: 44.4% | Forward Risk: WATCH
Reading this for the first time? We are in a Late Cycle regime — the economy is still growing, but leading indicators say growth is peaking and risks are building underneath. The stance is not paralysis: we hold 78% in equities because Late Cycle historically lasts 12–24 months and pre-emptive defensiveness destroys more value than it protects. The 7% cash is not idle — it is loaded for deployment at specific crisis signals (see The Watch List). Nothing has triggered yet. No prior reading required — every issue stands alone.
The Strait of Hormuz is open. Oil is back at $83. The 28% probability of a liquidity crisis I flagged two weeks ago has evaporated. The market is breathing a sigh of relief, and my confidence in the Late Cycle label has dipped from 47% to 44% as a result. But the regime hasn’t changed. The market is mistaking the removal of an acute geopolitical threat for an all-clear on the macro front. It’s not. The foundation is still fragile—growth is weak, inflation is sticky, and the yield curve is screaming an expansion signal that the real economy can’t deliver. We’ve stepped back from the cliff’s edge, but we’re still standing on shaky ground.
The Evidence
The dashboard shows a market caught between conflicting signals: financial conditions are easy, but the real economy is losing steam. This is the classic late-cycle divergence.
Growth: The Slowdown is Here
| Signal | Value | Status | What It Means |
|---|---|---|---|
| GDP Growth | 0.5% | WEAK | The economy is losing momentum, growing at a pace that historically precedes a stall. |
| Building Permits (Z-Score) | -0.51 | WEAKENING | Housing activity is below its historical norm, a reliable leading indicator of economic slowdown. |
| Consumer Confidence | 56.6 | WEAK | Sentiment is at recessionary levels, contradicting the surface-level stability. |
| ISM Manufacturing (Z-Score) | -0.59 | STABLE | Manufacturing employment is balanced but offers no momentum to offset weakness elsewhere. |
| Unemployment Rate | 4.3% | MODERATE | The labor market remains the last pillar of strength, still within a normal range. |
Inflation & Policy: Sticky, Not Spiking
| Signal | Value | Status | What It Means |
|---|---|---|---|
| CPI YoY | 3.32% | ELEVATED | Inflation remains above the Fed’s target, forcing policy to stay restrictive and eroding consumer purchasing power. |
| PCE YoY | 2.8% | TARGET | The Fed’s preferred gauge is nearer to target, providing some policy flexibility. |
| Wage Growth | 3.52% | ELEVATED | Wage pressures persist above target, creating a sticky floor under services inflation. |
| WTI Crude Oil | $83.24 | ELEVATED | Oil prices are still high enough to add cost-push pressure, but the acute shock has passed. |
| Fed Funds Rate | 3.64% | NEUTRAL_RATE | Policy is near neutral, neither accelerating nor braking growth significantly. |
Financial Stress & Markets: Complacency Rules
| Signal | Value | Status | What It Means |
|---|---|---|---|
| VIX | 17.94 | NORMAL | Volatility is complacent, pricing a standard risk environment despite macro fragility. |
| Credit Spread (Baa-10Y) | 1.01% | TIGHT | Corporate credit markets are confident and risk-on, showing no fear of default. |
| NFCI | -0.465 | NORMAL | Broad financial conditions are loose and supportive of risk assets. |
| Real Yield (10Y TIPS) | 2.3% | RESTRICTIVE | Real interest rates are tight, creating a headwind for gold and pressuring equity valuations. |
| Yield Curve (10Y-3M) | 1.64 | STEEPENING | The curve is steepening well above its historical norm, a signal that historically precedes economic expansion, not late-cycle slowdown. |
Where Are We Heading?
The forward scenario probabilities show a confused picture. The base case is still a messy, extended Late Cycle, but the paths out of it are numerous and almost equally probable.
| Scenario | Probability | Timeframe | What It Means For Portfolios |
|---|---|---|---|
| LATE_CYCLE | 43.1% | 0-3 months | Base Case. Extended fragility. Range-bound markets vulnerable to shocks. Hold equity but keep dry powder. |
| GOLDILOCKS | 23.6% | 3-6 months | Gradual improvement. Growth stabilizes, inflation moderates. Maximum equity exposure is warranted. |
| REFLATION | 12.5% | 3-6 months | Growth re-accelerates, inflation picks up. Beneficial for cyclicals and commodities. |
| HARD_LANDING | 12.5% | 3-6 months | Growth contracts meaningfully. Defensive assets outperform; deep equity cuts required. |
| STAGFLATION | 10.0% | 3-6 months | Stagnant growth with persistent inflation. Worst-case for 60/40 portfolios; favor real assets. |
Trip Wire Status Board The distance to danger has increased, but the wires are still active.
- High-Yield Option-Adjusted Spread: Current 2.85% | Wire 5.0% | Distance: 43.0% | Status: WATCH
- VIX: Current 17.94 | Wire 35.0 | Distance: 48.7% | Status: WATCH
What Does History Say?
History resolves the contradiction between weak growth and easy financial conditions the same way 79% of the time: the market signals win, and a shock arrives to tighten conditions violently.
Setup Analogs: When Growth & Finance Diverge
- 2018 Q4 Fed Policy Error (80% similar): S&P -20%. Lesson: Fed policy errors in a late-cycle create sharp, fast sell-offs that are quickly reversed by a policy pivot.
- 2023-2024 Soft Landing (79% similar): S&P +24%. Lesson: Soft landings are possible, but only when the labor market stays strong during disinflation.
- 1998 Q3-Q4 LTCM Crisis (78% similar): S&P -10%. Lesson: Liquidity crises with strong underlying fundamentals resolve quickly if the central bank acts as lender of last resort.
The message from history is not to exit — it is to know what you are watching for. In 2018 and 1998, the repricing was sharp but brief. In 2023, the market ground higher despite every macro reason not to. In all three cases, investors who sold early on macro caution underperformed those who held and acted only when a specific signal broke. That is the discipline this framework enforces.
The Entry Question
Should I add to equities now? The existing 78% equity allocation stays. The 7% cash reserve does not deploy yet.
To be precise about what these mean: the 78% equity position is the hold — it reflects that Late Cycle historically lasts 12–24 months and the credit market (high-yield spread at 2.85%) shows zero stress. Selling now, ahead of any data signal, would be a macro call masquerading as risk management. History says that trade loses.
The 7% cash is different. It is not a hedge against uncertainty — it is ammunition reserved for a specific kind of panic. The entry framework is mechanical:
- Stage 1 (Fear Gauge): Trigger = VIX > 35.0 for 3 consecutive days. Why this moment? Panic is peaking, creating an oversold condition. Action: Deploy 50% of cash into broad equity (SPY).
- Stage 2 (Credit Stress): Trigger = High-Yield Option-Adjusted Spread > 5.0%. Why this moment? Corporate credit is pricing real default risk — the deeper, more fundamental low. Action: Deploy remaining 50% of cash.
The 7% cash is not a sign of doubt. It is a loaded position waiting for a specific entry signal. The 78% equity is the conviction. They are not in conflict.
Both triggers are far from active. VIX is at 18, high-yield spreads are at 2.85%. The position is set. Nothing changes until the data does.
The Late Cycle Playbook
Sector Rotation: The market is in a broad, risk-on rotation, but leadership is defensive.
- Leading (Risk-On): Energy (XLE +12.2%), Real Estate (XLRE +5.2%), Utilities (XLU +4.9%)
- Lagging (Risk-Off): Technology (XLK), Communications (XLC), Discretionary (XLY)
Validated Strategies for LATE_CYCLE:
- Mean Reversion (STR-002 — VALIDATED): 8.54% CAGR, 0.39 Sharpe. Works best in the range-bound, whipsawing markets typical of late-cycle.
- Deep Value (INSTITUTIONAL — PENDING): Targets undervalued assets that have been oversold on growth fears.
- Yield Curve Hedge (INSTITUTIONAL — PENDING): A tail-risk hedge for when the curve signal finally breaks.
The Portfolio
The allocation below bridges the contradiction between a cautious macro view and a 78% equity stake. The high equity weight is not a bullish call — it's a structural posture. Late Cycle is historically still a positive regime for equities. Protection comes from the regime switch (cutting equity to 15% when the data turns to HARD_LANDING), not from pre-emptive defensiveness here.
| Asset Class | Current Regime (LATE_CYCLE) | Target Regime (GOLDILOCKS) | Recommended Now |
|---|---|---|---|
| Equity | 75% | 85% | 78% |
| Bonds | 6% | 3% | 2% |
| REITs | 3% | 6% | 3% |
| Commodities | 2% | 2% | 2% |
| Gold | 4% | 1% | 4% |
| TIPS | 2% | 1% | 2% |
| Intl Bonds | 2% | 1% | 2% |
| Cash | 6% | 1% | 7% |
| Total | 100% | 100% | 100% |
Rationale: The engine’s “Recommended Now” allocation adds a 3% tilt from the base Late-Cycle portfolio toward more equity and cash. This reflects the receding immediate crisis risk (less need for bonds) but maintains dry powder (higher cash) because the path forward remains unclear. Crash protection will come from swiftly switching to the Hard Landing allocation when MARY confirms the regime shift, not from holding bonds today.
Options Overlay: FEAR TRADE (Leverage Panic)
- Strategy: BUY_PUT_SPREAD on SPY (Buy 10% OTM Put, Sell 25% OTM Put, 90 DTE).
- Allocation: 0.8% of portfolio cost.
- Rationale: Cheap tail insurance. Expected to expire worthless 80% of the time, but pays off massively in a crash. Think of it as fire insurance—you hope you never need it.
The Watch List
These are engine-defined binary triggers. If one hits, act immediately.
- VIX > 35.0 for 3 consecutive days. → Action: Execute Stage 1 capital deployment.
- High-Yield Option-Adjusted Spread > 5.0%. → Action: Execute Stage 2 capital deployment.
- Initial jobless claims (weekly) > 236,500. → Action: Trim equity by 5%.
- NFCI > -0.429. → Action: Flag tightened financial conditions; prepare for risk-off.
- MARY confirms regime shift to HARD_LANDING or LIQUIDITY_CRISIS. → Action: Immediately adopt full crisis allocation (15% equity, 30%+ cash).
Data as of April 17, 2026. Sources: FRED, CBOE, University of Michigan, OECD. MARY engine: regime scoring engine with historical analog matching. This is not investment advice — it is a decision framework built on data.
Get this research delivered
New analysis, directly to your inbox. Research notifications only.