CIO Weekly Intelligence Report
CIO Weekly Intelligence Report — April 07, 2026
**LATE_CYCLE — The Calm is a Trap**
Forward Scenario Probabilities
Recommended Portfolio Shift
The Verdict
LATE_CYCLE — The Calm is a Trap
Regime: LATE_CYCLE | Confidence: 49.7% | Forward Risk: ELEVATED
Reading this for the first time? We are in a Late Cycle regime — the economy is still growing, but the leading indicators say the growth is peaking and the risks are building underneath. This week, 22 economic signals have simultaneously crossed their historical danger levels, putting a 28% probability on a sharp market shock within the next 3 months. Jump to The Portfolio to see the recommended defensive allocation (equity cut to 39%, cash raised to 22%), and The Watch List for the five specific triggers that would change it. No prior reading required — every issue stands alone.
The market is pricing a soft landing. MARY is pricing a crisis. The engine now puts a 28% probability on a sharp liquidity shock within the next 0-3 months — the kind that reprices everything fast, before you can react. That number comes from 22 economic warning signals that have all crossed their historical danger thresholds simultaneously. Consumer confidence at recession levels. Oil above $100. Borrowing costs still restrictive. None of these are small wobbles. They are the exact conditions that preceded every major market break in the past 30 years.
My confidence in the current regime is below 50% — the data is pulling in two directions. Strong GDP on the surface. Everything underneath it cracking. This week is about capital preservation, not opportunity.
The Evidence
Every major signal is showing green or yellow today — but red for the next 3-6 months. That gap between the present reading and the historical warning level is where the danger lives.
Growth: The Divergence is the Story
| Signal | Value | Status | What It Means |
|---|---|---|---|
| GDP Growth (QoQ) | 4.4% | STRONG | Strong on the surface — but at this level, late-cycle GDP has historically been a final peak before a hard slowdown, not a sign of durability. |
| Consumer Confidence | 56.4 | WEAK | Recession-level sentiment. Consumers feel what the GDP data doesn't show yet. Historical danger threshold crossed. |
| Building Permits (Z-Score) | -0.51 | WEAKENING | Housing is rolling over. Every recession in the past 40 years was preceded by permits turning negative. Danger threshold crossed. |
| ISM Manufacturing (Z-Score) | -0.77 | STABLE | Flat momentum. Historically, ISM at this level during late-cycle precedes contraction within 2 quarters. Danger threshold crossed. |
| Initial Jobless Claims | 214k | LOW | The last remaining pillar of strength. Still holding — but 9.5% away from the level that has historically signaled labor market deterioration. Watching closely. |
Inflation & Policy: Anchored Today, Dangerous Tomorrow
| Signal | Value | Status | What It Means |
|---|---|---|---|
| CPI YoY | 2.66% | TARGET | Inflation is contained right now — this is good. But historically, CPI at exactly this level during late-cycle has preceded a regime transition within 3-6 months. The calm is the setup, not the all-clear. Historical warning level crossed. |
| PCE YoY | 2.83% | TARGET | Same story as CPI. The Fed's preferred gauge is anchored today, but the warning signal is already lit. |
| WTI Crude Oil | $115.22 | SHOCK | A major supply shock. Oil above $100 directly raises input costs across every sector and puts upward pressure on CPI. Danger threshold crossed. |
| Fed Funds Rate | 3.64% | NEUTRAL_RATE | Policy is neutral in level, but historically, rates at this absolute level during late-cycle are restrictive enough to slow credit growth. The market is already stretched. Historical warning level crossed. |
Financial Stress: The Warnings Are Lit
| Signal | Value | Status | What It Means |
|---|---|---|---|
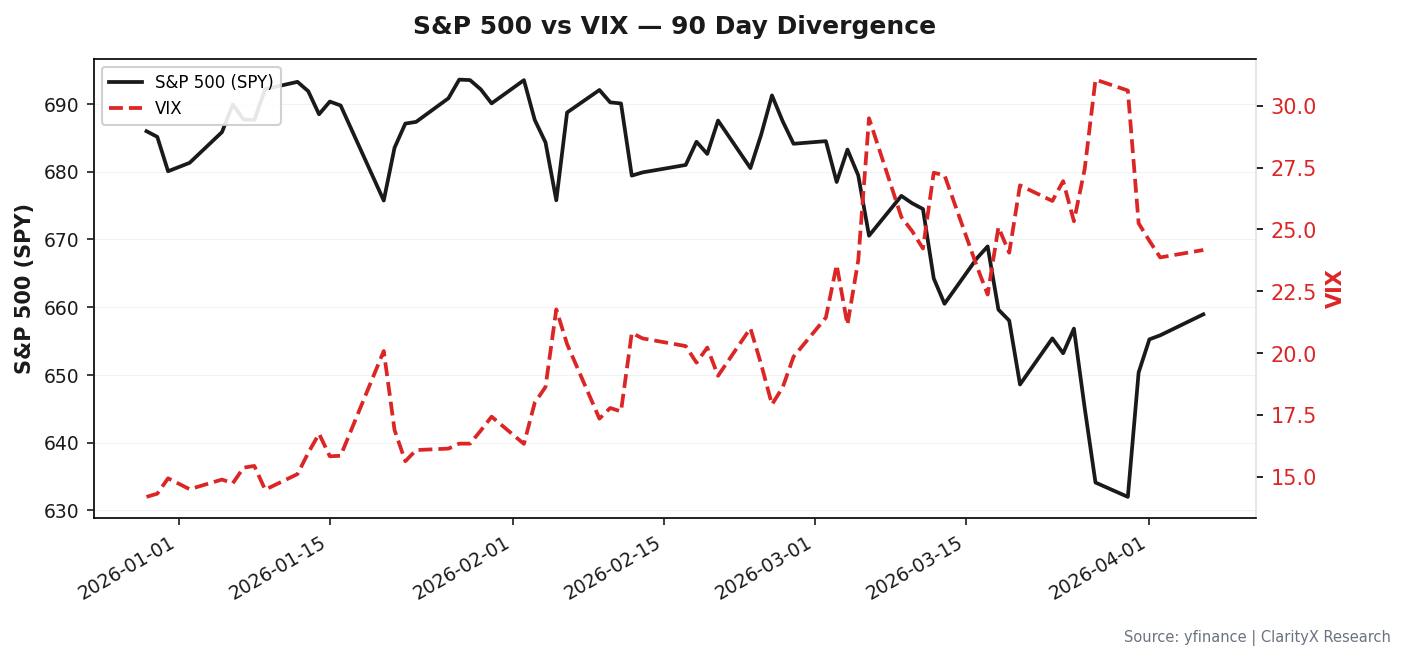
| VIX | 23.87 | ELEVATED | Elevated uncertainty. The market is nervous but not yet panicked. Danger threshold crossed. |
| NFCI | -0.475 | NORMAL | This is the most dangerous signal in the dashboard. Financial conditions look perfectly normal — but historically, when NFCI is this loose right before a crisis, the snap-back is violent. The calm before the storm. Historical warning level crossed. |
| Credit Spread (BAA-10Y) | 1.09% | TIGHT | Credit markets are still complacent. This is the last domino — it hasn't fallen yet, but it's 45% away from the level that historically signals a credit event. Watching closely. |
| Yield Curve (10Y-2Y) | +1.85% | STEEPENING | A steepening yield curve is normally bullish. But at this steepness, historically, it has preceded a policy mistake — the Fed tightening into a slowdown. Historical warning level crossed. |
Market & Global Signals
| Signal | Value | Status | What It Means |
|---|---|---|---|
| Gold | $4,276 | HIGH | A screaming safe-haven bid. When gold is at all-time highs while equities are near highs, someone is very worried about something. |
| Global Overlay | SYNCHRONIZED_EXPANSION | 37% Conf. | Fragile consensus. Japan is tightening, China is decelerating. The weak Yen is fueling a risk-on carry trade that could unwind fast. |
The story is in the gap between today's readings and where history says trouble starts. Every major signal is currently in a normal or healthy range. Every one of them has also crossed the level that historically precedes a regime break.
Where Are We Heading?
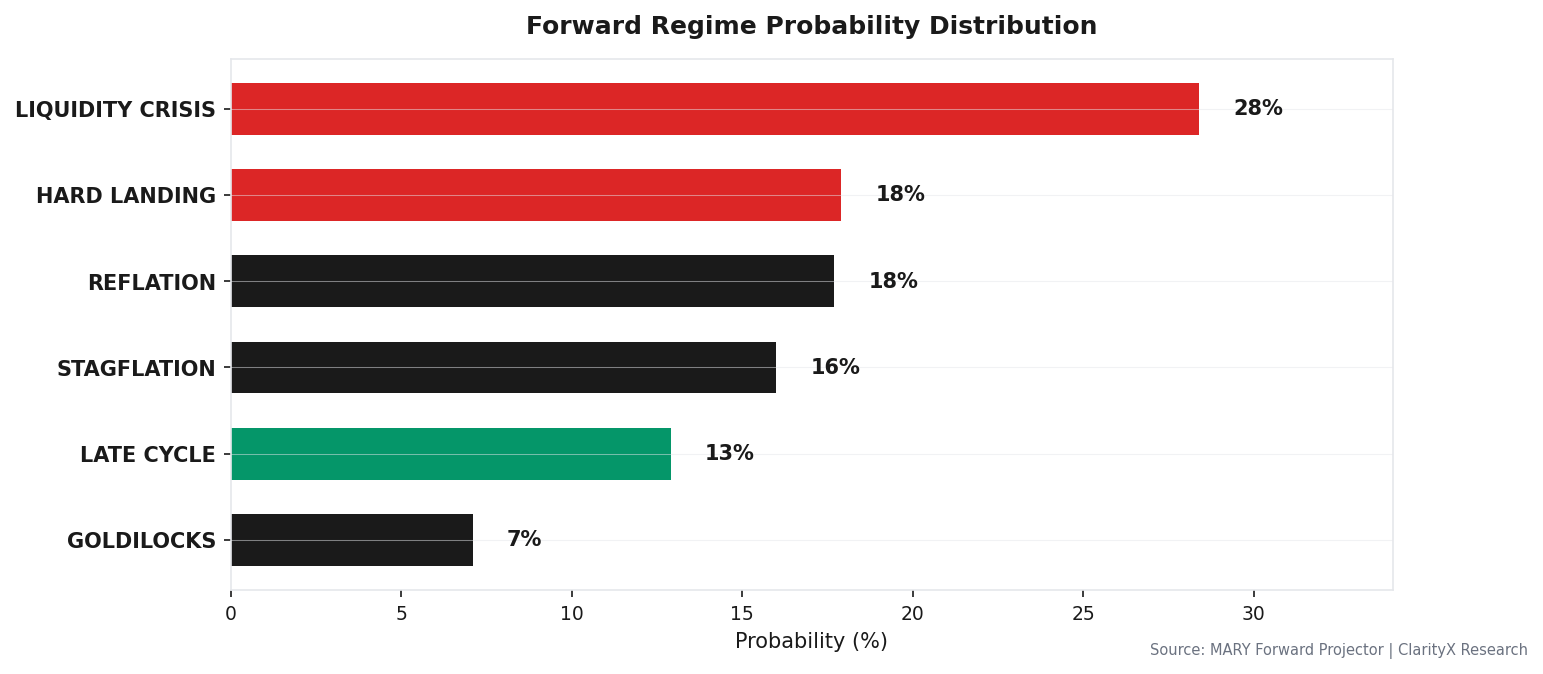
The forward scenario map has shifted decisively toward risk. LIQUIDITY_CRISIS is now the single highest-probability outcome at 28.4%, with a 0-3 month window. This is not a prediction of a 2008 replay — it's a high probability of a sharp, fast repricing driven by a credit or funding event.
Forward Scenario Probabilities
| Scenario | Probability | Timeframe | Confidence |
|---|---|---|---|
| LIQUIDITY_CRISIS | 28.4% | 0-3 months (fast) | LOW |
| HARD_LANDING | 17.9% | 3-6 months (gradual) | HIGH |
| REFLATION | 17.7% | 3-6 months (gradual) | HIGH |
| STAGFLATION | 16.0% | 3-6 months (gradual) | MEDIUM |
| LATE_CYCLE | 12.9% | 0-3 months (base) | HIGH |
| GOLDILOCKS | 7.1% | 3-6 months (gradual) | HIGH |
Add up LATE_CYCLE (12.9%) + LIQUIDITY_CRISIS (28.4%) + HARD_LANDING (17.9%) and you get 59% probability that the market either stays under pressure or breaks hard. The soft landing path (GOLDILOCKS at 7.1%) is the least likely outcome in this data set.
Signals That Have Crossed Historical Danger Levels: 22 The three most important ones driving the defensive allocation shift are Consumer Confidence, Building Permits, and NFCI — all three have crossed levels that historically preceded major regime transitions.
Signals Near Their Danger Levels: 4
- VIX reaching 35 is the main one to watch (currently 31.8% away). That level has historically been the "panic threshold" where institutional forced selling begins.
What Does History Say?
This section has two parts. First: what today's setup looks like historically. Second: what happens if the warning signals are right.
Part 1 — The Setup: What Today Looks Like
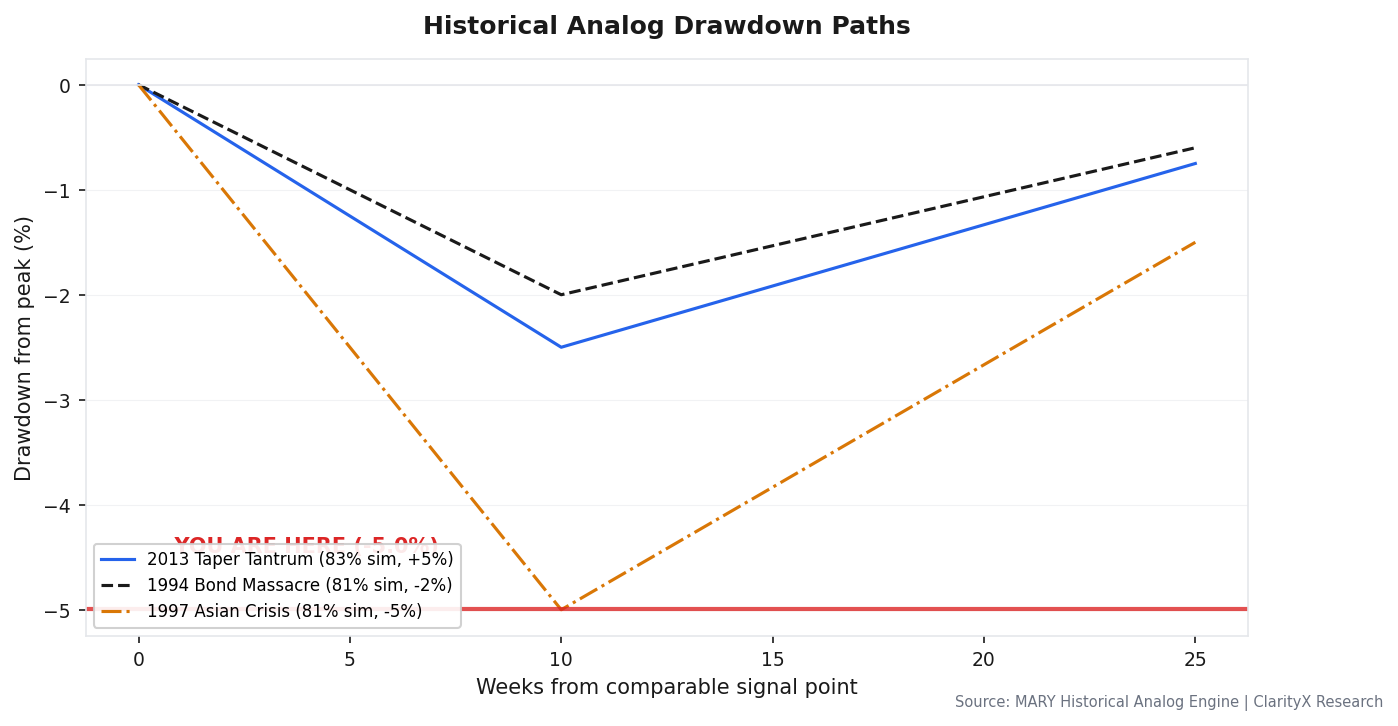
The three closest matches to today's conditions are all late-cycle periods with anchored inflation and tightening liquidity. In each case, the surface data looked fine — and then it broke.
| Period | Similarity | S&P End-to-End | The Actual Path |
|---|---|---|---|
| 2013 Taper Tantrum | 83% | +5% | Bonds fell -5%, equities fell -6% in the drawdown — then recovered when the Fed delayed. The final return looks mild. The path wasn't. |
| 1994 Bond Massacre | 81% | -2% | The Fed doubled rates unexpectedly. S&P was roughly flat for the year but fell -9% during the downturn before recovering. Fixed income was destroyed. |
| 1997 Asian Crisis | 81% | -5% | S&P fell -10% in the drawdown, then staged a V-recovery when it became clear the US economy wasn't directly exposed. |
Critical point: These end-to-end numbers are small — +5%, -2%, -5%. A reader could look at this and think "I can handle that, I'll just hold." That thinking is exactly what leads to the worst outcome. The -10% drawdown in 1997 was the part that triggered margin calls, panic selling, and strategy abandonment. The people who "held through it" weren't holding calmly — they were watching their portfolios fall fast, under pressure to act, at exactly the moment when acting was wrong.
The final return is not what kills investors. The journey does.
Part 2 — If The Warnings Are Right: What Comes Next
The analogs above show what the setup looks like. If the 28% crisis scenario plays out, history has three precedents for what actually happens:
| Period | What Triggered It | S&P Drawdown | How Long |
|---|---|---|---|
| 1998 LTCM / Russia Default | Hedge fund leverage collapse + sovereign default | -20% | 3 months, then V-recovery when Fed cut |
| 2018 Q4 Fed Policy Error | Fed overtightened into a slowdown | -20% | 3 months, reversed when Fed pivoted |
| 2007-2008 GFC Lead-in | Credit market freeze, not just a scare | -57% from peak | 4+ years to full recovery |
The difference between 1998/2018 and 2008 was one thing: whether the credit market froze completely or just got scared. A -20% scare with a V-recovery is survivable if you don't panic. A -57% drawdown over 4 years is not — it forces selling, wipes out leverage, and breaks investor discipline permanently.
Right now, Credit Spreads (BAA-10Y) are at 1.09% — still tight. If spreads blow out past 2%, that is the signal that we are heading toward 2008, not 1998. That is Stage 2 of the entry framework below.
MARY's regime detection has 76% historical accuracy in LATE_CYCLE. One in four of these warnings is a false alarm. But the cost of the 24% of correct calls — where it avoids a -20% to -57% crash — vastly outweighs the cost of being cautious when the market keeps going up.
In 1997, the S&P started falling in July. By October it was down -10%. At that point every headline was screaming crisis, your portfolio was bleeding, and the rational instinct was to sell and stop the pain. Most people did. Then the market turned around and recovered — ending the year at only -5% from where it started. The people who sold at -10% locked in that loss. The people who held ended up at -5%. The difference wasn't information — it was the ability to hold through the worst moment. That is exactly the test we are facing now.
The Entry Question
Should you deploy capital now? No.
We are at a -6% drawdown from the S&P 500's recent high. Based on the historical analogs, the median max drawdown from similar setups was -12% before the bottom. We are likely in the early stages of the drawdown, not the late stages.
The staged entry framework below is built around three specific market signals. Each trigger has a plain-English explanation of why that moment — which will feel terrifying — is actually the right time to act.
Staged Entry Framework:
Stage 0 — Now: Hold. Raise cash. Implement the defensive portfolio below. Allocate 2% to put options as direct insurance against a fast drop. Do not buy more equity here. The warning signals are still building, not resolving.
Stage 1 — Trigger: VIX > 35 for 3 consecutive days Why this matters: VIX above 35 means institutional investors are panic-buying protection at any price. That level of fear historically marks the point where the fastest, most indiscriminate selling is happening. It feels like the worst moment. It is also when long-duration bonds (TLT) and gold (GLD) spike highest — because everyone is fleeing to safety at the same time. Action: Begin scaling 10% of cash into long-duration bonds (TLT) and gold (GLD). You are not buying equities yet — you are buying the assets that go up in a panic.
Stage 2 — Trigger: Credit Spread (BAA-10Y) > 2.0% Why this matters: When credit spreads blow out past 2%, it means companies are being charged significantly more to borrow. That is the signal that the stress has moved from the stock market into the actual economy. It is also the signal that separates a 1998-style scare (spreads stayed contained) from a 2008-style crisis (spreads exploded). At this point, the worst of the equity selling is usually close to done. Action: Deploy 30% of cash into high-quality equity ETFs (VOO, QQQ). The pain is visible, the credit market is pricing it, and the risk/reward has shifted.
Stage 3 — Trigger: MARY confirms regime shift to HARD_LANDING or LIQUIDITY_CRISIS Why this matters: When MARY formally shifts regime, it means the data has confirmed what the warning signals were predicting. This is the capitulation point — maximum fear, maximum headlines, maximum pressure to not buy anything. It is also, historically, close to the bottom. Action: Full deployment into the crisis portfolio allocation.
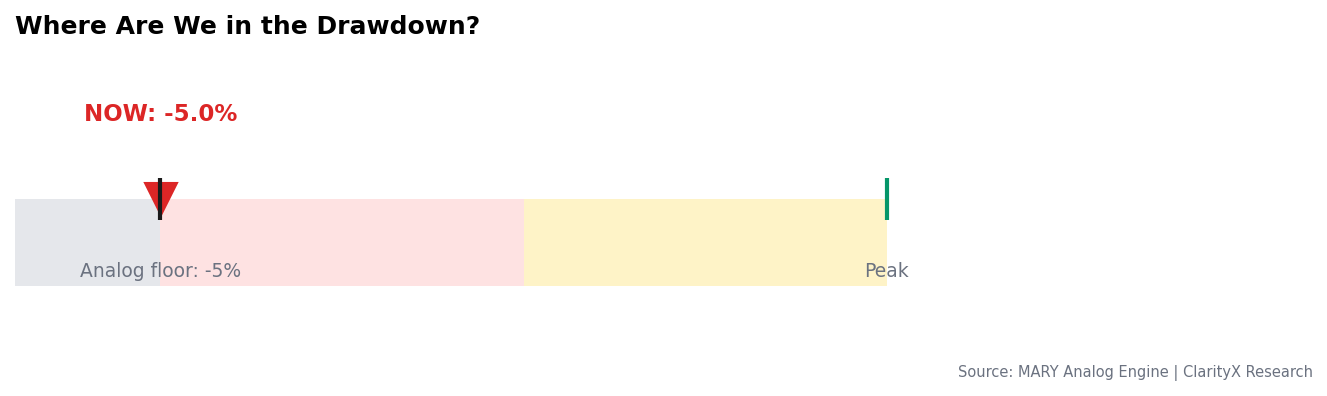
The instinct to buy the dip is strongest when the dip is only half done. Your job this week is not to be a hero. It's to be a survivor.
Sector Rotation & Strategy
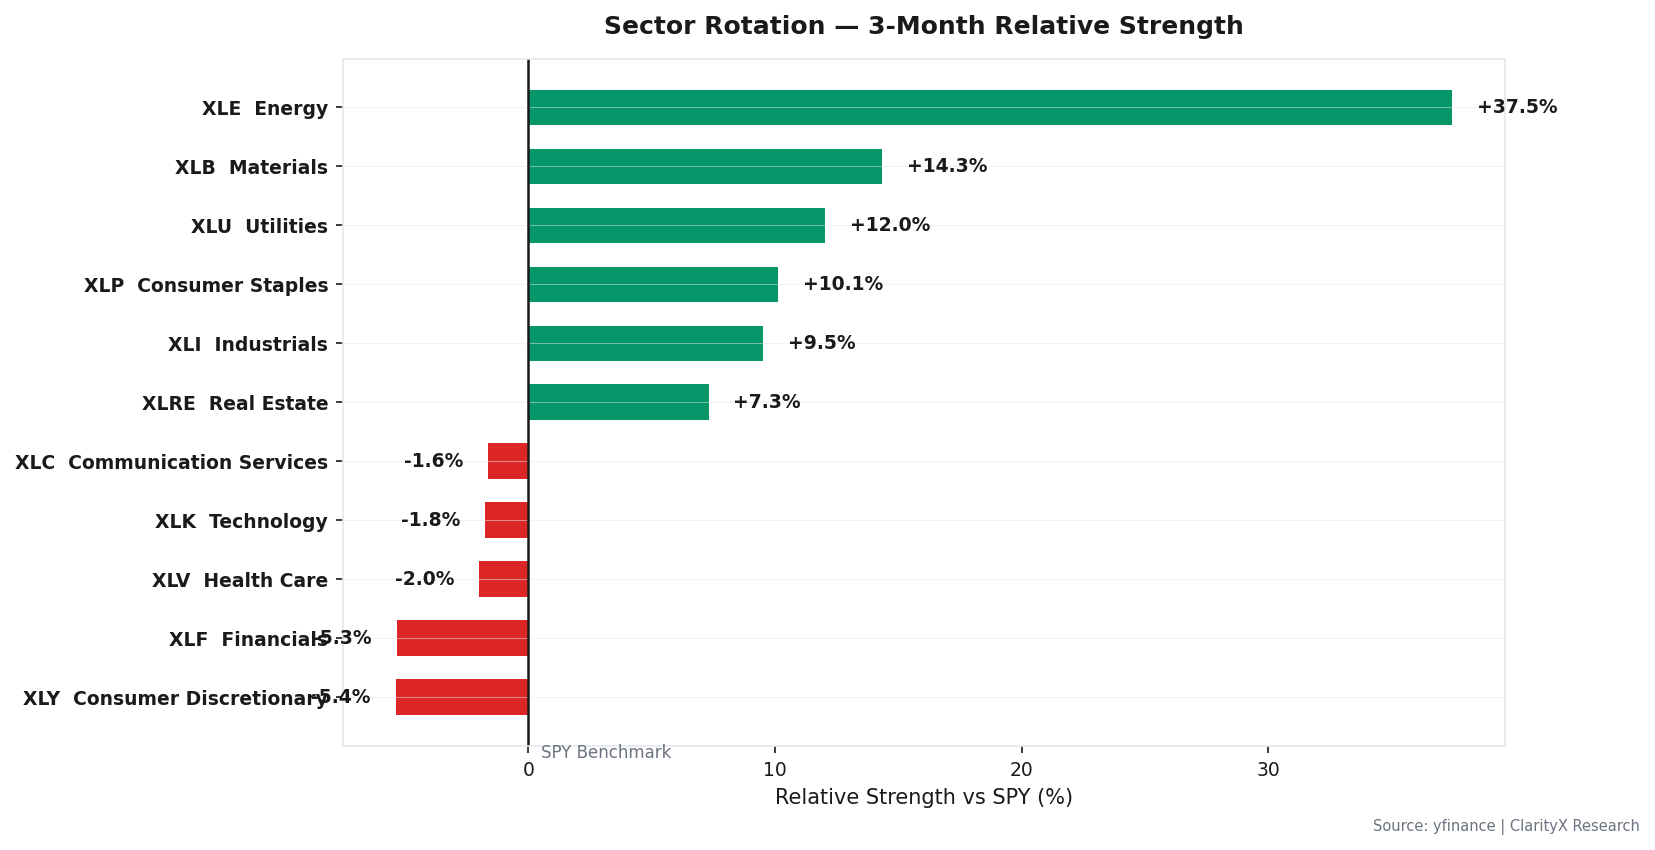
The sector map shows a market chasing the last sources of momentum: Energy (XLE) and defensive Utilities (XLU). This is not a healthy rotation — it's a late-cycle scramble into whatever is still working.
Sector Relative Strength (Last 30 Days)
- Leading: XLE (+37.5%), XLB (+14.3%), XLU (+12.0%)
- Lagging: XLV (Healthcare), XLK (Tech), XLY (Discretionary)
Energy is a double-edged sword: high oil prices boost energy company profits today, but are also one of the key signals driving the crisis probability. Utilities' strength is a defensive signal — money is rotating out of growth and into stability. Avoid Industrials (XLI) and Discretionary (XLY) — they are most exposed to the consumer confidence collapse already underway.
Strategies That Work in This Regime:
- Mean Reversion (STR-002): Use now. Validated at 8.54% CAGR in late-cycle environments. Works in range-bound, volatile markets where prices oscillate around a mean rather than trending.
Strategies to Avoid:
- Momentum (STR-003): Avoid. Momentum strategies reverse violently when regimes shift. Being long momentum into a liquidity crisis is one of the most dangerous positions in markets.
- Trend Following (MACD/EMA): Avoid. High whipsaw risk in the transition volatility we are likely entering.
- CANSLIM/Growth: Avoid. High-quality growth stocks get hit hardest in liquidity crises as investors de-risk indiscriminately.
The Portfolio
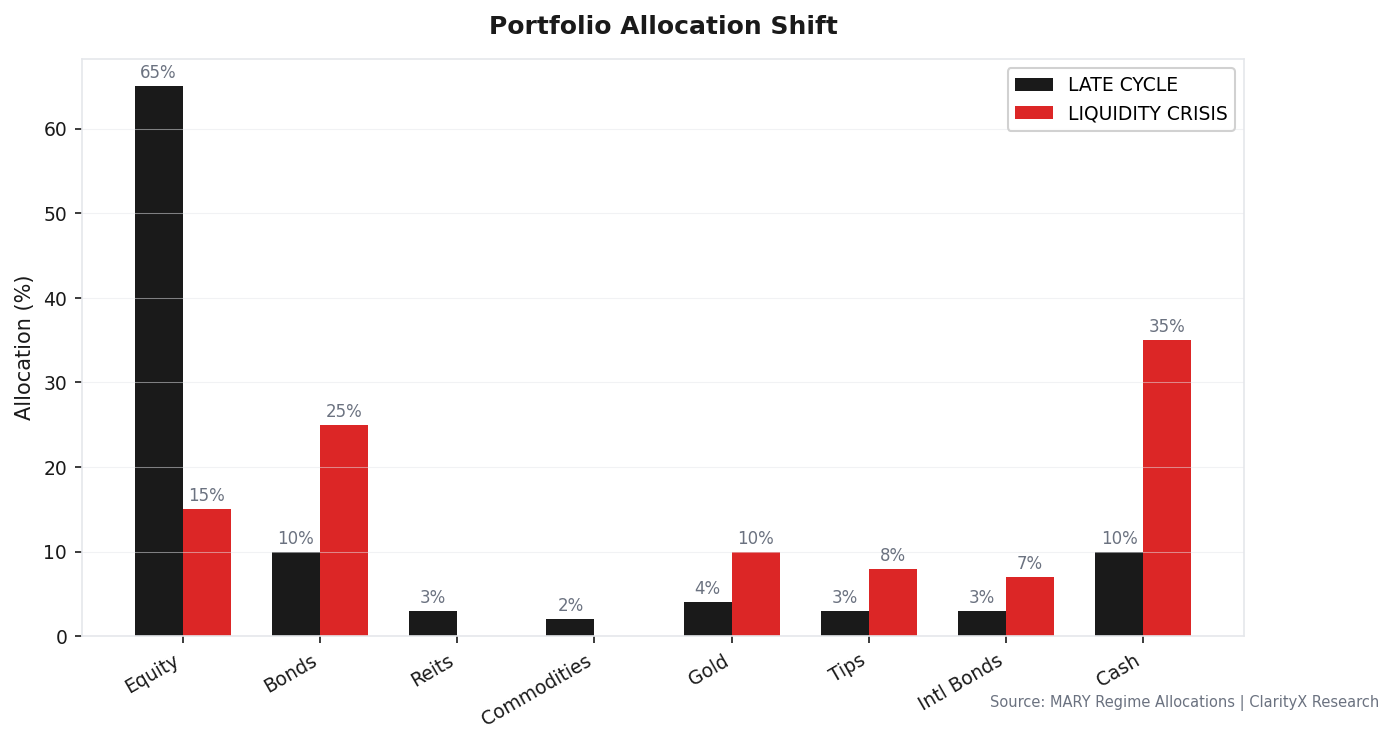
The engine has applied a 30% defensive shift to the standard LATE_CYCLE allocation, driven by the 22 crossed danger thresholds. The "Recommended Now" column is not an estimate — it is the engine's pre-computed output, blending the current regime's stance with the probability-weighted risk of a LIQUIDITY_CRISIS.
Target Allocation & Shift
| Asset Class | Current Regime (LATE_CYCLE) | If Crisis Hits (LIQUIDITY_CRISIS) | Recommended Now |
|---|---|---|---|
| Equity | 65% | 15% | 39% |
| Bonds | 10% | 25% | 21% |
| Cash | 10% | 35% | 22% |
| Gold | 4% | 10% | 9% |
| TIPS | 3% | 8% | 3% |
| REITs | 3% | 0% | 2% |
| Commodities | 2% | 0% | 1% |
| Intl Bonds | 3% | 7% | 3% |
Why this shift:
- Equity cut from 65% to 39%: Consumer Confidence, Building Permits, and NFCI have all crossed their historical danger levels. Staying fully invested in equities when all three are lit simultaneously has historically been the setup for the largest drawdowns.
- Cash raised to 22%: Dry powder for the staged entry framework above. You cannot buy at Stage 2 or Stage 3 if you have no cash.
- Gold raised to 9%: Direct hedge against the oil shock and any loss of confidence in the Fed's ability to navigate a soft landing.
- Bonds raised to 21%: Duration exposure as a shock absorber. If a liquidity crisis hits, bonds rally as everyone flees to safety — this position captures that.
This is a capital preservation portfolio. It sacrifices some upside to avoid the left-tail risk that 22 warning signals are pointing toward. The math is simple: if the 28% scenario is wrong, you miss some upside. If it's right and you're not positioned, you take a -20% to -57% hit.
The Watch List
Five specific triggers. If any hit, take the prescribed action immediately — do not wait for more confirmation.
- VIX crosses 35 and holds for 3 days. Execute Stage 1 of the entry framework. Scale into TLT and GLD.
- Credit Spread (BAA-10Y) crosses 2.0%. Execute Stage 2. Deploy 30% of cash into VOO and QQQ. This is the signal that separates a scare from a crisis.
- MARY confirms regime shift to HARD_LANDING or LIQUIDITY_CRISIS. Execute Stage 3. Full deployment into crisis portfolio.
- Initial Jobless Claims cross 236,500. Increase cash by 5% (trim equities). The labor market — the last pillar of strength — is beginning to crack.
- NFCI crosses -0.429. Reduce equity by another 5%. Financial conditions have tightened past the secondary warning level.
Get this research delivered
New analysis, directly to your inbox. Research notifications only.